30 results
6th grade laboratories for Microsoft Excel
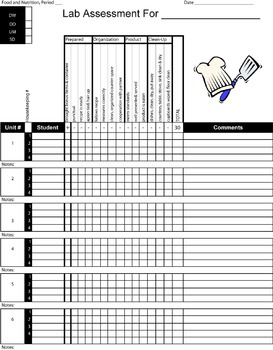
Foods Lab Evaluation Sheet 2 - Teacher Version
This is another template to collect data / assess and evaluate students' performance in the foods lab.
This template is in an Excel format so you can have a master copy for your students' names and change and edit as you go.
The categories for assessment are:
Prepared
Organization
Product
Clean Up
There are 3-4 criteria that fall under each category.
Subjects:
Grades:
4th - 12th
Types:
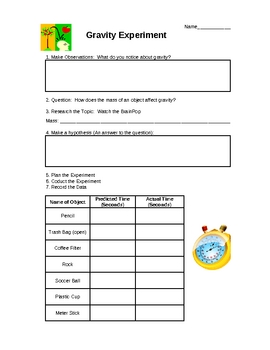
Gravity Experiment
In this experiment, students use the scientific method to explore gravity. Every step of the scientific method is included. Students use common items to test the speed of falling from a certain height. Students also create a line graph during their analysis. This experiment is a fun way to remind students about this scientific method while incorporating math.
Subjects:
Grades:
4th - 6th
Types:
Weather Tracking in Excel
Compatible with Google Sheets, Google Classroom, or as a stand-alone file on a PC, this product is a must have for any teacher comparing weather conditions in multiple locations!
BEFORE YOU BUY: This file is part of a larger unit. Save yourself money by purchasing the Super Science Set for Weather and Climate nstead of buying each file separately.
Purchased alone, you get:
⭐ An Excel workbook that enables students to track the weather for 5 different locations as a whole class or individ
Subjects:
Grades:
4th - 8th
Types:
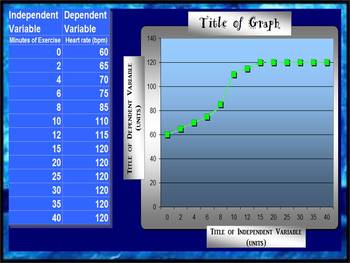
LINE GRAPH MAKER (AUTOMATIC)
This spreadsheet allows you to insert your independent and dependent variables into a chart and voila!... a line graph is generated as you enter in each piece of new data! Students love to take their data from a lab and watch as a graph is made right before their eyes! You can change all of the titles on the chart and the graph to suit your classes laboratory experiment needs! Students can easily print out their data to include in their lab reports!
Grades:
2nd - 12th
Types:
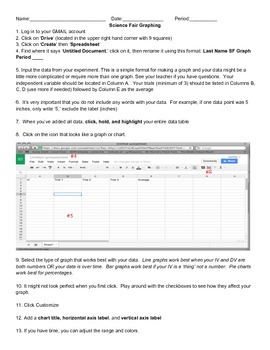
How To Graph Using Google Spreadsheets
This is a step-by-step guide on how to use Google Spreadsheets for students in grades 5-12. Use this as a resource when guiding students through the process. Included with the directions is sample data for students to use when practicing graphing. Perfect for science experiments and science fair!
Subjects:
Grades:
5th - 12th
Types:
BAR GRAPH (AUTOMATIC)
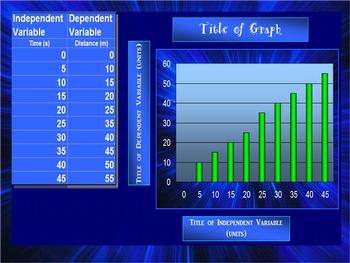
This spreadsheet allows you to insert your independent and dependent variables into a chart and voila!... a bar graph is generated as you enter in each piece of new data! Students love to take their data from a lab and watch as a graph is made right before their eyes! You can change all of the titles on the chart and the graph to suit your classes laboratory experiment needs! Students can easily print out their data to include in their lab reports!
elementary science class, middle school sc
Grades:
2nd - 12th
Types:
Basic Coding Activity in Excel (LEGO Programming Extension)
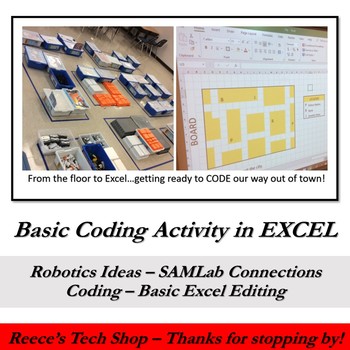
Are you looking for an introductory activity to Coding that can easily be upgraded to extensive coding or robotic programming? This will activity will take you step by step to creating a "city" in EXCEL (we actually recreated the city that we built in our classroom, but you can just create it in EXCEL) and then shows you how to CODE out of the city. With the help of snip tools and pens, you have numerous coding challenges for Warm-Ups or Coding Extensions. Since we actually built the city, st
Grades:
6th - 8th
Types:

Interactions and Ecosystems Activity Bundle
Designed to support hands-on environmental education. Includes a FREE long-range planner template!Originally designed for use in the Alberta Science 7 Curriculum. I have taught these lessons for a few years and students have been engaged and excited throughout the lessons. Requires minimal planning and materials, and each can be done in one 60 min class.
Subjects:
Grades:
6th - 9th
Types:
Flower Dissection with Pink Jasmine
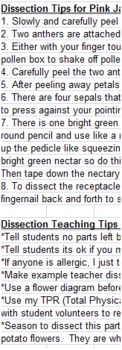
Students will dissect a pink jasmine flower to review structure and function of plant reproduction parts. Included is a student handout that organizes student dissection as well as has an alternative virtual dissection website for those allergic to pollen. Students further demonstrate their understanding by creating similes for each structure and function of each flower part. Included are teaching tips and dissection tips gathered from 15 years of teaching experience. When my principal evalu
Subjects:
Grades:
4th - 9th
Types:
Ecology Lab: Micro-Plot sampling and graphing
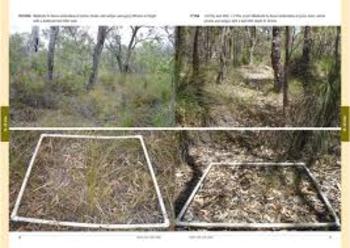
Combined with field work (access to a forest is required), students collect data, and then return to class to use the data in two separate graphs. They create a paper-and-pencil graph, and they follow a set of detailed instructions to use their data in order to complete a graph using Microsoft Excel.
Subjects:
Grades:
4th - 6th
Types:
Google Spreadsheet: Shoe Cleaning Lab
The "Making Babies Lab: Baby Yoda" and "Characteristics of Life Lab" had such great feedback from other educators I thought I would go ahead and make a similar one with one of my favorite introductory experiments: the "The Perfect Clean" Virtual Lab!Guiding Question: Which cleaning methods are most effective for cleaning tennis shoes?Supplementary Resources: Instructional Video Part 1Teacher Tips:1. Hook (CTE Connection:) Introduce students to the topic by showing them some videos of new busines
Grades:
6th - 12th, Higher Education
Types:
NGSS:
MS-ESS3-2
, MS-ESS3-1
, MS-ESS3-5
, MS-ESS3-4
, MS-ESS3-3
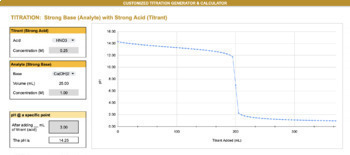
pH Calculator & Titration Curve Generator - Strong Acids & Bases
Create your own customized titration curves within seconds for worksheets, assessments, handouts or any other use!This resource comes with TWO generators/ calculators: 1. A titration of a strong acid with a strong base and 2. A titration of a strong base with a strong acid The customized generator allows YOU to CHOOSE:Chemical identity of the titrant AND analyteVolume of analyte being titratedConcentration of the analyteConcentration of the titrantPick and choose what combinations you
Subjects:
Grades:
6th - 12th, Higher Education
Types:
NGSS:
HS-PS1-7
Waves Lab Electronic Notebook : ELN: Waves Unit
Electronic/Digital Lab Notebook in Google Sheets, Numbers and Excel. I created this to streamline the Lab Process. It can be paired with IoT sensors.This Lab Notebook is divided up into a Dashboard, Pre-Lab Inquiries, Observations Log, Data Analysis, and Post-Lab Inquiries.This meets the Scientific Process and Science Inquiry requirements. The Observation Log houses the unit's vocabulary with links to the definitions so students can reference itas they enter data. There is an automatic graph, Ti
Grades:
6th - 12th
Types:

Homeostasis Heart Rate Lab
This lab can be used for middle school sciences, any Biology-based science class, or mathematics statistics classes. Included are a word document with instructions, lab, an excel spreadsheet with example data, a blank sheet with formulas that will calculate data, and a PowerPoint with student instructions.
Subjects:
Grades:
6th - 12th, Higher Education
Types:
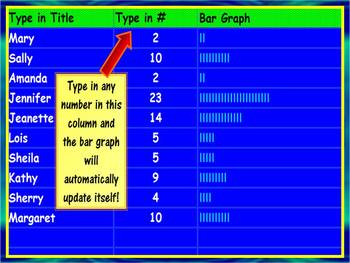
Automatic Bar Graph Maker
This activity can be used to teach students of all ages about bar graphs. This spreadsheet can be used to introduce the concept of bar graphs to elementary students as well as implemeted by mid-level & high school students in lab reports and/or presentations. It is extremely quick and easy to use! Just type in a set of numbers and it automatically creates a simple bar graph. And check out my other graph templates for line and bar graphs! They are definately worth your time!
Grades:
K - 12th
Types:
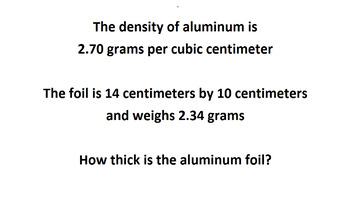
Thickness of aluminum cans through density
This folder includes these documents.
1 This document: contents and information for the teacher
2 FOR THE TEACHER: Density lab; This is your document for preparation and information. The preparation will take less than an hour.
3 EXERCISE Student data sheet with questions
4 ANSWERS Students data sheet with questions
5 ENRICHMENTAL SUPPLEMENTAL aluminum rolls
6 ANSWERS ENRICHMENT SUPPLEMENTAL aluminum rolls
7 The short video that was used as a preview. This is a higher quality versi
Subjects:
Grades:
6th - 12th
Types:
Report writing for students
You can view the images and hear my narration at YouTube URL
https://youtu.be/7HeXCH_rDMY
Copyright (C) Peter Rony 2015 All rights reserved.
I am a chemical engineering educator by profession. This PDF is an important STEM activity that is targeted for teachers starting at level 3 and continuing to level 12. It is not sufficient to have just a laboratory course. As much as possible, students should obtain quantitative “data” as a result of their experiments -- and not just qualitativ
Subjects:
Grades:
3rd - 12th
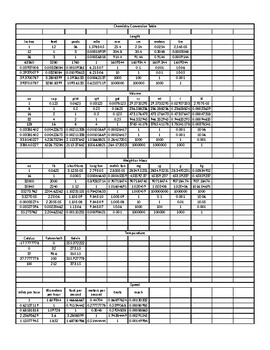
All in one conversion table
The conversion table has just about everything you need to make your daily conversions as well as the scientific conversions that are a bit tougher to do. This spreadsheet contains eight different conversion tables that are easy to use. Each conversion starts with one starting unit that is then converted to all other types of measurements within that group.
Subjects:
Grades:
3rd - 12th, Higher Education, Adult Education
Types:
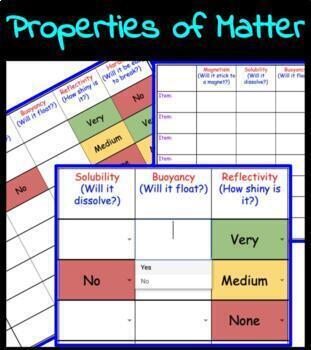
Properties of Matter Observation Worksheet
This color coded Google Sheet is perfect for the virtual classroom. It is formatted with color-coded dropdown lists, making it streamlined for easy grading. The nature of the formatting also makes this a great option for students requiring modifications. Educators are able to make a copy for each student in Google Classroom.
Subjects:
Grades:
2nd - 8th
Types:
NGSS:
5-PS1-3
, 2-PS1-2

Summer Pool Party Zoom Virtual Background
Use this fun virtual background for a change of scenery in Zoom, Google Meet, or Microsoft Teams!This resource is a .png file, which you will upload to the video conferencing platform of your choice. Please be sure your computer supports virtual backgrounds before purchasing this resource. By purchasing this resource, you may use the virtual background for YOUR CLASSROOM only. If you want to share with other teachers, you will need to purchase multiple licenses. Multiple licenses are available a
Subjects:
Grades:
1st - 12th
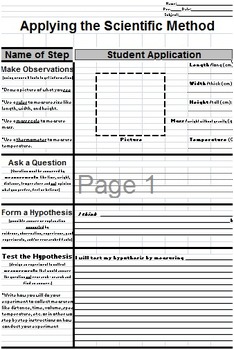
Applying the Scientific Method
This is a generalized but organized format in which students can apply various experiments and visually distinguish the steps of the scientific method. This activity worksheet also includes teaching tips for conducting one simple and cheap experiment involving ladybugs. Don't worry, I give tips to preserve all ladybugs' lives and students usually take them home.
Subjects:
Grades:
6th - 9th
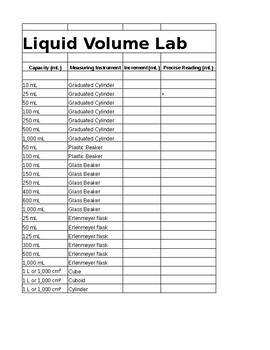
Liquid Volume Lab
using the metric system, students find the increment, estimate, and measure the actual reading in different measuring instrument. Food coloring can be added to water for better viewability
Subjects:
Grades:
5th - 12th
Types:

Speed Lab Data Sheet Graphing Speed
This printable works with the speed lab tennis and softball.
Graphing speed in terms of distance and time
Subjects:
Grades:
6th - 10th
Types:
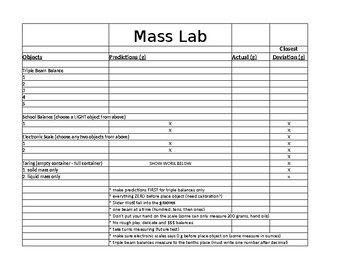
Mass Lab Spreadsheet
great spreadsheet to make predictions and calculate deviations
Subjects:
Grades:
6th - 12th
Types:
Showing 1-24 of 30 results

