539 results
Graphing activities for Easel
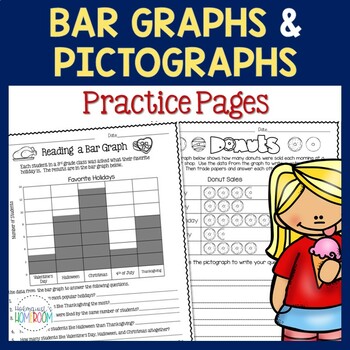
Bar Graphs & Pictographs - 3rd Grade
These bar graph and pictograph pages will give your students extra practice reading, interpreting, and creating bar graphs and pictographs.You may also be interested in my Fall Bar Graphs & Pictographs and Thanksgiving Bar Graphs and Pictographs!UPDATE: There is now a digital version that you can assign to your students in Google Classroom - it's ready to go with answer boxes and directions - all you have to do is assign it through TpT Easel! In the first two activities, students answer ques
Subjects:
Grades:
3rd
Types:
CCSS:
Also included in: Bar Graphs & Pictographs Year Long Bundle
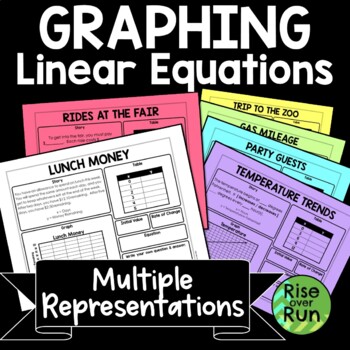
Linear Equations Graphing Worksheets with Multiple Representations
These activity sheets will help students make connections between linear graphs, equations, tables of values, and the stories they represent. This resource is one of my favorites and best sellers! Included are 6 different sheets, each with a different scenario and a different representation given. For example, students may be given an equation, and they must fill in a graph to match, missing parts of the story, a table, and identify the initial value and rate of change. The sheets range in d
Grades:
8th - 9th
Types:
CCSS:
Also included in: 8th Grade Math Activities & Lessons Bundle for the Whole Year
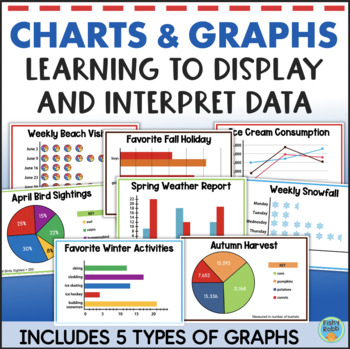
Math Graphing Activities Interpreting Graphs and Data Worksheets Line Pie Bar
Representing and interpreting data using graphs and charts is the focus of this math resource for upper elementary grades. It helps students explore and understand data analysis. For each activity, students will use a graph to answer questions about the data. They will also create another type of graph, chart, or table based on the information provided. This added step really helps students understand the various types of graphs and ways in which data can be displayed.These activities are perfec
Subjects:
Grades:
3rd - 5th
Types:
Also included in: Third Grade Math & Reading YEAR LONG BUNDLE 1500+ Pages
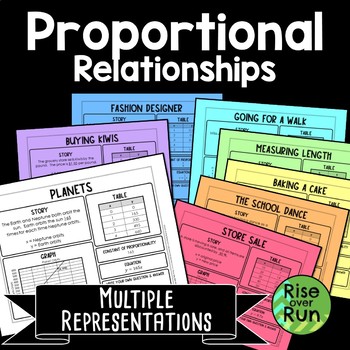
Proportional Relationships Graphing with Multiple Representations
These multiple representation math tasks help students make connections between graphs, tables, equations, and real world scenarios. Students are given a little information and must think how to fill in the rest!8 activity sheets each include: a story a grapha tableconstant of proportionalityan equation a space for students to write their own question and answer. A blank template is included as well so students can create their own proportional relationship.Multiple representations are a great w
Grades:
7th - 8th
Types:
Also included in: 8th Grade Math Activities & Lessons Bundle for the Whole Year
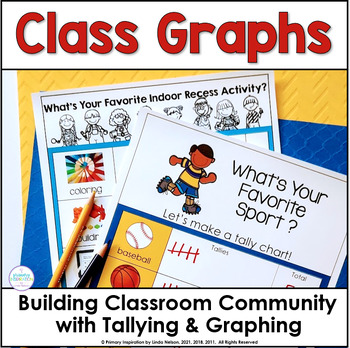
Bar Graphs & Tally Marks - Graphing Math Data to Build Classroom Community
This fun set of graphing activities gives your students lots of relevant practice collecting and interpreting data with ready-to-use bar graphs and tally mark charts. Plus, it builds classroom community and develops meaningful connections! Here's what this graphing and tallying resource includes!➯ 23 one page horizontal and vertical bar graphs designed to build classroom community as your students learn about how they are alike and different. Topics range from favorite foods, sports, and books,
Subjects:
Grades:
K - 3rd
Types:
CCSS:
Coordinate Graphing Ordered Pairs Activities - Printable or Google Classroom
Activities and mystery pictures to teach coordinate graphing and ordered pairs so kids can plot points and solve problems on a coordinate plane. Teach your students about graphing in the first quadrant of the coordinate plant with these woodland animal themed pages!**Easy to use for distance learning!** Digital layer already added - Assign in Google classroom with the TpT digital activity tool and kids can draw lines with the pen and enter answers in text boxes.Contents:*Coordinate Plane Vocab A
Grades:
3rd - 5th
Types:
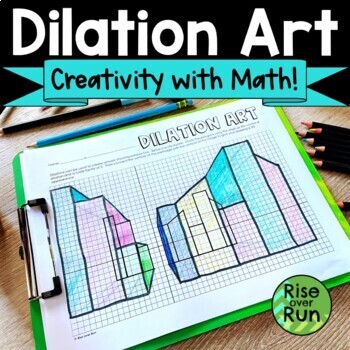
Dilation Activity Creating 3-D Perspective Art
Students explore how dilating images creates 3D perspective artwork in this fun math activity. The first page has a city skyline of buildings on a coordinate plane. Students dilate the figures by a scale factor of 2 to create a 3D drawing. The answer key is included for this page. Next students are given a blank coordinate grid to create their own preimage, which they then dilate by a scale factor of 0.5.This exercise shows students how math can be used to create artwork!This activity could be
Grades:
8th - 10th
Types:
Also included in: 8th Grade Geometry Unit Activities and Lessons
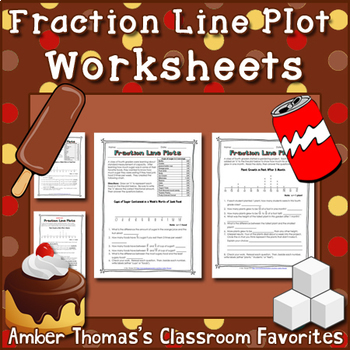
Fraction Line Plot Worksheets
Do your students need more practice learning to make a line plot to display a data set of measurements in fractions of a unit? I know when I went over the Common Core Standards CCSS Math 4.MD.B.4 had me scratching my head. We had NO resources to cover it. So I made my own! These two worksheets use contexts that fourth graders are likely to be familiar with when it comes to measurement units and fractional parts. The types of questions vary between reading a line plot, creating a line plot wi
Subjects:
Grades:
4th - 5th
Types:
Also included in: Fraction Line Plot Bundle
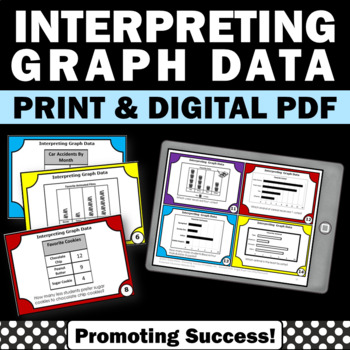
Bar Graph Practice Reading Charts and Graphs Analyzing Data 2nd 3rd Grade Math
Data and Measurement: You will download 30 bar graph task cards for your 2nd, 3rd or 4th grade students to practice reading, analyzing, and interpreting charts and graphs data. They are a great supplement for your 2nd or 3rd grade measurement and data math standards.For your convenience, you will download both TPT digital EASEL and printable PDF resource formats. ☛ Please click on the PREVIEW above.You may use the printable bar graph practice task cards in your math stations or centers for fun p
Subjects:
Grades:
2nd - 3rd
Types:
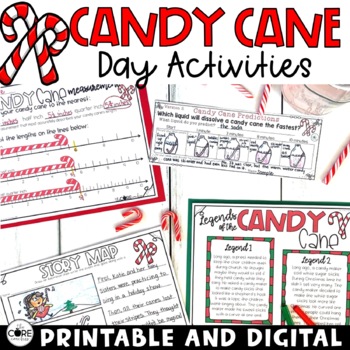
Candy Cane Day Activities - Candy Cane Science - December Themed Lesson Plans
Candy Cane themed activities to engage your students in meaningful learning mixed with fun! These Candy Cane activities are offered in both print and digital so teachers can mix it up to find the perfect balance of versatility that meets the face-to-face and device-based learning needs of a modern classroom.This resource is preloaded to Google Slides and SeeSaw. One click links are provided for the activities on both platforms making it easy to assign to students digitally. Please view the vid
Grades:
1st - 3rd
Types:
Also included in: 12 Days of Christmas Countdown - Christmas Activities Print and Digital
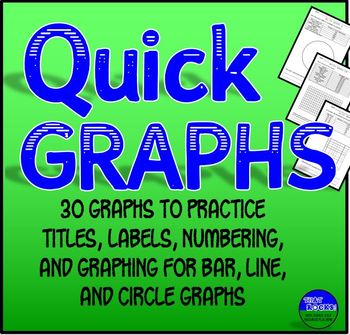
Graphing Practice 30 Quick Graph Sheets for Bar, Line, & Pie Graphs
Graphing Practice for Middle School! These are great to use as bellringers, exit tickets, or just extra practice, and work well for either a science class or math class.Using a data table, students supply the title, label the X- and Y-axes, practice finding appropriate number intervals, and make the graph. My average sixth grade students take 5 - 10 minutes per graph. The half-sheet format saves paper. Now available as ready-to-use EASEL activities!Each data table includes factual informatio
Grades:
5th - 8th
Types:
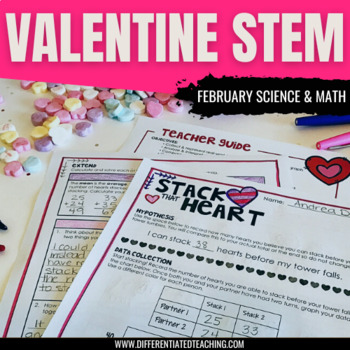
Candy Heart Stacking: Valentines Day Math Activities February STEM Challenge
This hands-on Valentine's Day STEM activity tests students' building skills while reinforcing important mathematical and science concepts. Students work individually or with partners to build the tallest tower using conversation hearts. Then they analyze the data they collected through their trials. A great Valentine's Day activity...or perfect for those conversation heart leftovers later in February!Your purchase includes: Teacher directions with clearly written objectives, materials list, and
Subjects:
Grades:
3rd - 5th
Types:
Also included in: February Activities Bundle: Book Study, Printables, Crafts, & More
Domain and Range of Functions Worksheet
Hey there, Math Teachers! Empower your students to master domain and range identification with our comprehensive worksheet! Our two-sided PDF worksheet includes 32 thought-provoking questions that cover identifying the domain and range of relationships given as ordered pairs, graphs, or tables.Using the vertical line test, students will learn to identify functions and define them as a relationship between x and y that assigns exactly one output for every input. Our easy-to-use answer key ensures
Grades:
8th - 9th
Types:
CCSS:
Also included in: Relations and Functions Introduction Worksheets Bundle
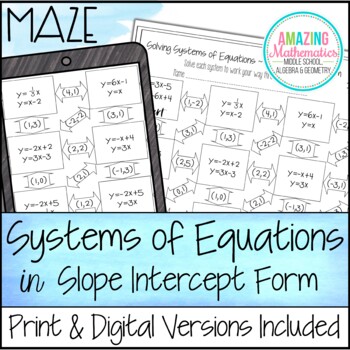
Solving Systems of Equations Maze - Slope Intercept Form - Solve by Graphing
Printable PDF & Digital Versions are included in this distance learning ready activity which consists of 11 systems of equations in slope intercept form that students must solve by graphing, elimination or substitution. Important InformationNot all boxes are used in the maze to avoid students from just figuring out the correct route. Students will have to correctly solve 8 systems in slope intercept form to complete the maze.Ways to Use this Maze1) Have students solve each system any way t
Grades:
7th - 10th
Types:
CCSS:
Also included in: 8th Grade Math Bundle ~ All My 8th Grade Math Products at 1 Low Price
Slope Intercept Word Problems Matching Worksheet
Hey Math Chefs! Are you ready to add a dash of flavor to your slope-intercept equation lessons? Get ready to embark on a delicious math adventure with our mouthwatering worksheet, served up with an Italian pizza twist! Why Choose Our Pizza Parlor Math Worksheet? Real-World Pizza Problems: Say arrivederci to boring math problems! Our worksheet features 15 scrumptious real-world situations that students must match with the appropriate Slope-Intercept Equation. From slicing pizza pies to delivering
Subjects:
Grades:
8th
Types:
Also included in: Graphing Linear Equations Worksheets Bundle
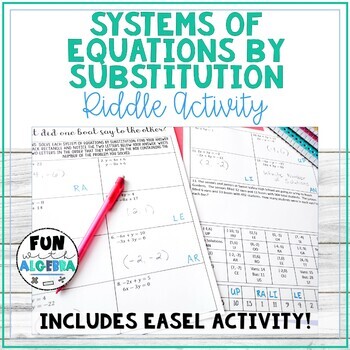
Solving Systems of Equations by Substitution Printable Algebra 1 Riddle Activity
Students will practice their skills solving 13 systems of equations by substitution using this riddle activity. Activity is self-checking, as students will know if they didn't do their problem correct when they do not see their answer on the answer chart on the back. Types of problems included:**3 equations: Both solved for y**2 equations: One solved for y**4 equations: Neither solved for y, but either x or y has coefficient of 1**3 equations: Neither solved for y, and neither x nor y has coeffi
Grades:
7th - 10th
Types:
Also included in: Systems of Equations Activity Bundle
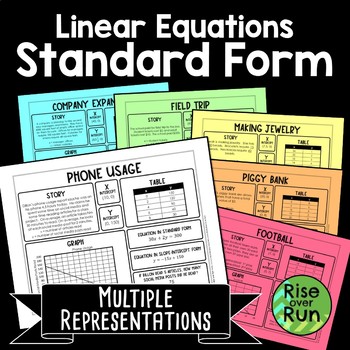
Graphing Linear Equations in Standard Form Real World Tasks
Help your students make sense of linear functions in standard form with these practice sheets. Students will see how equations, graphs, tables, and word problems all connect! 6 tasks are provided where students fill in missing information. They complete:a storya graphinterceptsa tablean equation in standard forman equation in slope-intercept formand answer a question about the scenarioEach of the 6 sheets provides just enough information so students can figure out the rest! A blank template i
Grades:
8th - 9th
Types:
CCSS:
Also included in: 8th Grade Math Activities & Lessons Bundle for the Whole Year
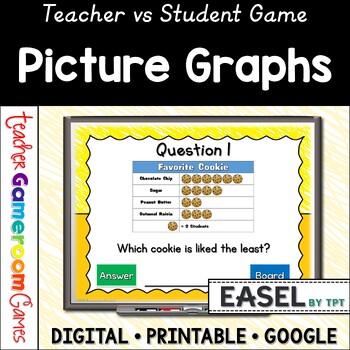
Pictographs Powerpoint Game | Picture Graphs | Digital Resources | Graphs & Data
Pictographs game! Students will answer questions about two picture graphs. Questions include most/least favorites, totals for each group, and comparing groups. There are 2 graphs in this game, each with 10 questions, giving you a total of 20 questions. The question disappears after you've clicked on it, so you know you've answered it. The scoreboard allows you to add scores during Slideshow Mode. Great digital resource for a quick math morning review or center activity. Great for individual prac
Subjects:
Grades:
K - 3rd
Also included in: Graphs Bundle | No Prep Digital Resources
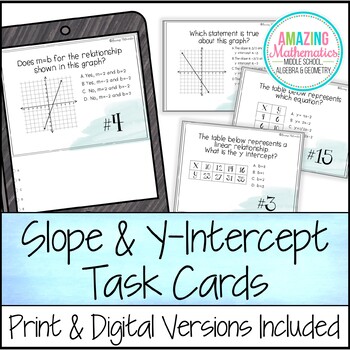
Slope and Y Intercept Activity Task Cards - PDF & Digital
8th grade students will love trying something different with these Slope & Y-Intercept Task Cards. They will keep them engaged all while practicing their understanding of slope in a variety of ways. Printable PDF, Digital & Easel by TPT versions are included in this distance learning ready activity which consists of a set of 15 task cards that cover the following skills:Determine slope and y intercept from graphs & tablesUnderstand the difference between proportional and non-propo
Grades:
7th - 10th
Types:
Also included in: 8th Grade Math Bundle ~ All My 8th Grade Math Products at 1 Low Price
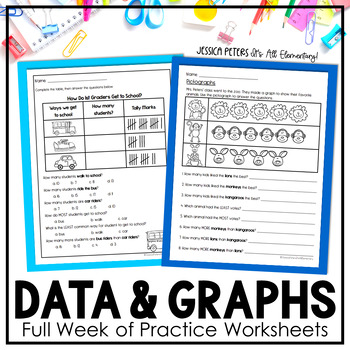
Data and Graphing Worksheets | Bar Graphs, Pictographs, Tally Charts | 1st Grade
Full week of Graphing and Data Worksheets for practice, homework, and assessment. Bar graphs, pictographs, tally marks, and table included. Appropriate for Kindergarten, 1st grade, and 2nd grade. If you are teaching graphing lessons next week, this should get you out the door more quickly! This packet includes a full week of practice worksheets, HW worksheets, and a test on graphing and data. Please note: I recently update this file to remove the large black heading at the top right of each page
Subjects:
Grades:
K - 2nd
Types:
CCSS:
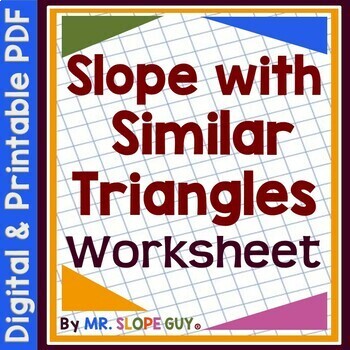
Finding Slope with Similar Triangles Worksheet
Hello Math Teachers! Are you looking for a fun way to teach slope of lines to your Pre-Algebra class? Check out this math worksheet that uses triangles to count rise and run and find slope visually.This engaging activity helps students see the same slope with different similar right triangles along a line on the coordinate plane. With 48 questions, including more challenging problems with scales that vary and smaller triangles inside larger ones, this two-sided worksheet is sure to keep your stu
Grades:
8th
Types:
CCSS:
Also included in: Finding Slope Worksheets Bundle
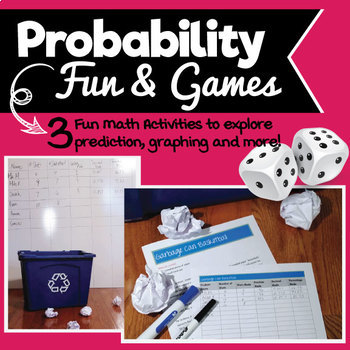
Probability Fun & Games! Exploring fractions, decimals, percentages & more!
Probability Fun & Games reinforces the concepts of: addition, prediction, graphing, fractions, decimals, and percents through three fun activities. Your students will be on the fast track to learning basic math skills. The packet include three activities - Roll Them Bones, Trash Can Basketball and What Color is Your Candy.
Included in this download are:
• Note to teacher with tips on using lessons
• Three activities with instructions
• Discussion prompts
• Ready-made charts for students to
Subjects:
Grades:
3rd - 8th
Types:
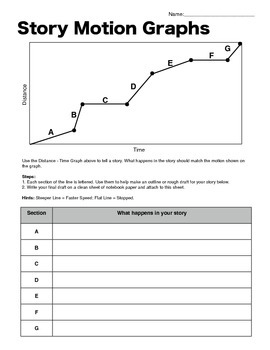
Story Motion Graphs - Distance-Time Graph Writing Activity
This writing activity will allow you to see how well students can interpret a distance-time graph, and let them use their imaginations as well.
Each section of the graph is labeled with a letter. In the table below, students can create an outline for their story that matches the motion graphed above. Then, they can write their final draft on a clean sheet. Even better: there is an advanced version for your higher-level thinkers. They must label the axis with units that match their story.
The
Grades:
5th - 8th
Types:
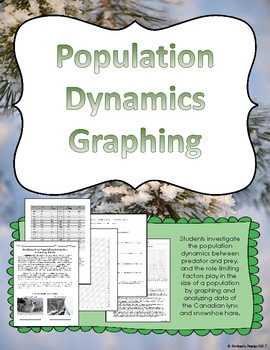
Predator and Prey Population Dynamics Graphing Activity
Students investigate the population dynamics between predator and prey, and the role limiting factors play in the size of a population by graphing and analyzing data of the Canadian lynx and snowshoe hare.I use this activity with my sixth grade students during our unit on ecosystems. We complete it as a class activity. You could make it an option in a choice project, a learning extension for higher level students, or an activity for a science center.The final page includes the completed graph
Grades:
5th - 8th
Types:
Showing 1-24 of 539 results


