TPT
Total:
$0.00

Relations and Functions Introduction Worksheets Bundle

Rated 5 out of 5, based on 2 reviews
5.0 (2 ratings)
;
Mr Slope Guy
1.6k Followers
Grade Levels
8th
Subjects
Resource Type
Standards
Formats Included
  • Zip
Pages
Five Worksheets
$10.99
List Price:
$14.50
You Save:
$3.51
Bundle
$10.99
List Price:
$14.50
You Save:
$3.51
Bundle
Share this resource
Report this resource to TPT
Mr Slope Guy
1.6k Followers
Easel Activities Included
Some resources in this bundle include ready-to-use interactive activities that students can complete on any device.  Easel by TPT is free to use! Learn more.

Products in this Bundle (5)

    Description

    Attention 8th grade math teachers! Are you looking for a comprehensive set of worksheets to introduce functions to your students? Look no further! These math worksheets on introducing functions are exactly what you need. These worksheets cover all the essential concepts related to functions, including domain and range, linear versus nonlinear, graphing stories, and much more. With a wide variety of practice problems, your students will gain a deep understanding of these fundamental concepts and will be well-prepared for more advanced topics in high school math.

    These worksheets are designed by an experienced math teacher and are aligned with the latest Common Core State Standards, and Florida's B.E.S.T. ensuring that your students will receive a high-quality education.

    Whether you're looking for homework assignments, in-class activities, or review materials, these worksheets are perfect for your needs. And with our easy-to-use digital format, you can easily print and distribute the worksheets to your students. Buy now and give your students the best possible start to their math education!

    Worksheets

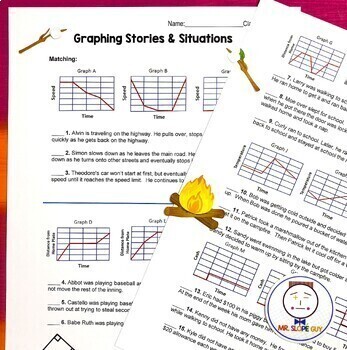
    • Graphing Stories and Situations Worksheet
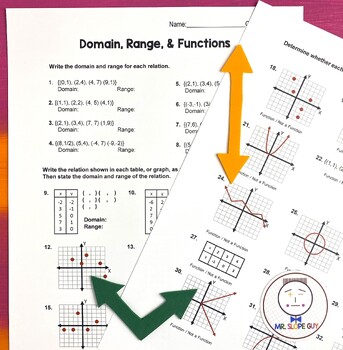
    • Domain and Range of Functions Worksheet
    • Describing Intervals of Functions Worksheet
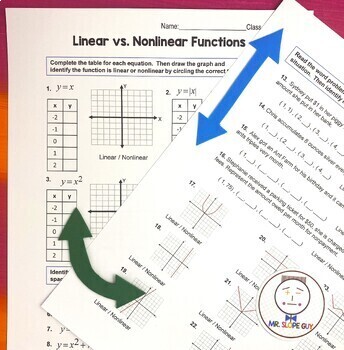
    • Linear versus Non-Linear Worksheet
    • Mapping Diagrams of Functions Worksheet

    Three include corresponding Easel Digital Activities.

    Many include an optional QR Code link to instructional videos for students on YouTube.

    Mr. Slope Guy


    Teacher Feedback

    "This was a much needed resource to help my students practice domain and range."

    "Students loved using all the resources that came with the bundle."

    Total Pages
    Five Worksheets
    Answer Key
    Included
    Teaching Duration
    N/A
    Report this resource to TPT
    Reported resources will be reviewed by our team. Report this resource to let us know if this resource violates TPT’s content guidelines.

    Standards

    to see state-specific standards (only available in the US).
    Understand that a function is a rule that assigns to each input exactly one output. The graph of a function is the set of ordered pairs consisting of an input and the corresponding output.
    Compare properties of two functions each represented in a different way (algebraically, graphically, numerically in tables, or by verbal descriptions). For example, given a linear function represented by a table of values and a linear function represented by an algebraic expression, determine which function has the greater rate of change.
    Interpret the equation 𝘺 = 𝘮𝘹 + 𝘣 as defining a linear function, whose graph is a straight line; give examples of functions that are not linear. For example, the function 𝘈 = 𝑠² giving the area of a square as a function of its side length is not linear because its graph contains the points (1,1), (2,4) and (3,9), which are not on a straight line.
    Describe qualitatively the functional relationship between two quantities by analyzing a graph (e.g., where the function is increasing or decreasing, linear or nonlinear). Sketch a graph that exhibits the qualitative features of a function that has been described verbally.

    Reviews

    Questions & Answers

    1.6k Followers