Slope and Y Intercept Activity Task Cards - PDF & Digital
- PDF
- Google Apps™
- Easel Activity

What educators are saying
Also included in
- This bundle includes all the notes, worksheets, & activities in my store that pertain to 8th Grade Mathematics.Does this Include Digital Resources?As of May 2024 over 80% of this bundle includes a digital Google Slides or Forms option.Please view the preview to view the content list & whichPrice $115.00Original Price $222.50Save $107.50
Description
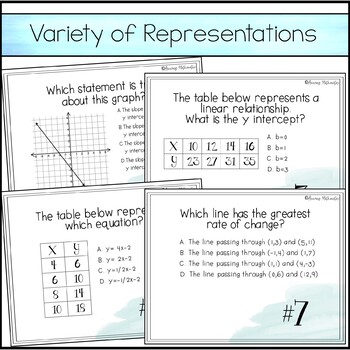
8th grade students will love trying something different with these Slope & Y-Intercept Task Cards. They will keep them engaged all while practicing their understanding of slope in a variety of ways.
Printable PDF, Digital & Easel by TPT versions are included in this distance learning ready activity which consists of a set of 15 task cards that cover the following skills:
- Determine slope and y intercept from graphs & tables
- Understand the difference between proportional and non-proportional graphs & tables
- Calculate slope when given two points
- Write a corresponding equation in y=mx+b form when given a graph or table
----------------------------------------------------------------------------------------
Please view the preview to see the resource in more detail
----------------------------------------------------------------------------------------
Distance learning?
- No problem! This activity now includes a Google Slides digital option!
- Explore the ⌨ Distance Learning in my store for more digital resources
Three Forms of Use Included
- Printable PDF
- Google Slides
- Easel by TPT
Important Information
These task cards are intended for an 8th grade Math classroom. High School Algebra students (that are on grade level) may find these too easy. They do work very well for beginning of the year Algebra review or remediation.
FYI for Texas Teachers
This product is not Texas specific but if you are a Texas Teacher it covers the following TEKS:
- 8.5F Distinguish between proportional and non-proportional situations using tables and graphs
- 8.5I Write an equation in the form y=mx+b to model a linear relationship between two quantities using tabular and graphical representations
- 8.4C Use data from a table or graph to determine the rate of change or slope and y-intercept in mathematical problems
What's Included
- 15 Task Cards
- Student Response Sheet
- Answer Key
Similar Activities
This product is also part of the following money saving bundle:
8th Grade Math Bundle - All My 8th Grade Math Products for 1 Low Price
Find the resource you need quickly & easily....
Download the FREE Amazing Mathematics Resource Catalog Today!
- Resource Catalog - 6th Math
- Resource Catalog - 7th Math
- Resource Catalog - 8th Math
- Resource Catalog - Algebra
- Resource Catalog - Geometry
-------------------------------------------------------------------------------------------------------
Sign up for my Secondary Math Newsletter
to receive a Free Pi-Rate Plotting Points picture.
-------------------------------------------------------------------------------------------------------
©Copyright Amazing Mathematics LLC
This product is to be used by the original purchaser only.
This product can NOT be uploaded to the internet by the purchaser.
Doing so is a violation of the copyright of this product.
Copying for more than one teacher, or for an entire department, school,
or school system is prohibited.
This product may not be distributed or displayed digitally for public view, uploaded to school or district websites, distributed via email, or submitted to file sharing sites.
The unauthorized reproduction or distribution of a copyrighted work is illegal.
Criminal copyright infringement, including infringement without monetary gain, is investigated by the FBI and is punishable by fines and federal imprisonment.


