Bar Graphs & Tally Marks - Graphing Math Data to Build Classroom Community
- PDF
- Easel Activity
What educators are saying
Description
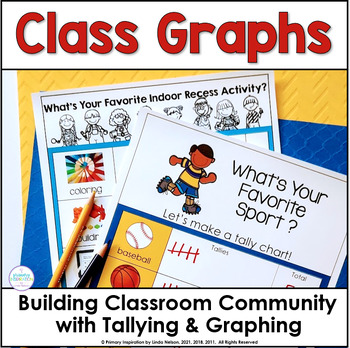
This fun set of graphing activities gives your students lots of relevant practice collecting and interpreting data with ready-to-use bar graphs and tally mark charts. Plus, it builds classroom community and develops meaningful connections!
Here's what this graphing and tallying resource includes!
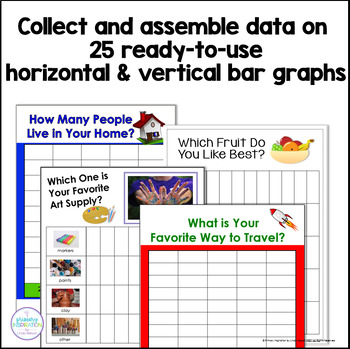
➯ 23 one page horizontal and vertical bar graphs designed to build classroom community as your students learn about how they are alike and different. Topics range from favorite foods, sports, and books, to recess games, letters in names, and backpack colors.
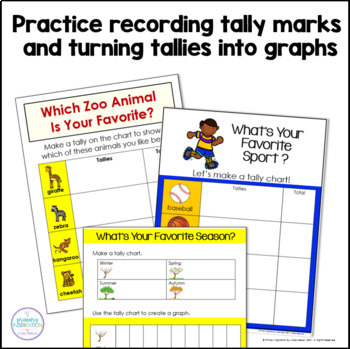
➯ Opportunities to record data with tally marks, and then transfer the data to bar graph format.
➯ Two blank graphs on which the topic is given, but your students will decide the labels.
➯ A cover to use to bind your completed graphs into a class book.
➯ A teaching chart to use on your interactive board or in a small group setting to introduce graphing and the parts of a graph.
How can you use this set of graphs and tallies with your class?
➯ As a back to school activity, complete a few graphs each day as part of your
circle time or morning meeting, leaving time to talk about the results get a
strong early start on building classroom community and developing
meaningful connections between you and your students.
➯ Use as a supplement during a math unit on data collection.
➯ Complete a graph and discuss it together as part of your calendar time once a week.
➯ Spend a few minutes of your math time each day with these easy prep activities and you'll have a high-interest bulletin board display for Parent Night!
➯ When you take your display down, assemble the pages into a book for your classroom library. A cover for your book is included in your download.
This activity includes a ready-to-use digital version using TPT’s Easel digital tool. You can access the Easel version via your My Purchases page or here on the product listing page. Adaptations for using the graphs include directions for using the pen tool and shapes to complete the graphs. You can also display the graph page on your interactive screen and your students can complete their own graphs along with you!
Here's what teachers have said about this graph collection!
⭐⭐⭐⭐⭐ Sandra said, "Students loved creating and interpreting their own graphs. This resource was great all year to practice and review graphing in a quick and fun way."
⭐⭐⭐⭐⭐ Shelley said, "This activity makes graphing engaging and collaborative. l have used it often and my students enjoy being able to "Interview" other grades/classrooms and come back to share their results with us. We display our graphs in the main hallway of our school and I love hearing students from other Grades/classrooms discuss how their results compare to others. Thanks for sharing."
⭐⭐⭐⭐⭐ Sarah said, "What a fun package! I liked the variety of topics included. As a surprise benefit, these graphing activities helped my kiddos gain confidence in asking other people questions."
*****
If you're looking for more ways to integrate tallying, graphing, and data analysis into your teaching, you'll love this set of 44 tallying, graphing, and writing activities about about plants, animals, landforms, bodies of water, magnets, rocks, weather and seasons, and space. Click here to see it!
******
Get TPT credit to use on your future purchases!
Go to your My Purchases page. Click on the Provide Feedback button to leave a rating and a short comment. You’ll earn TPT credits, which you can redeem on your future purchases!
Click the star on my home page to follow my store. You'll be the first to hear about my newest products and sales! You’ll also find an occasional “Followers Only” freebie in your TPT inbox, just to say thanks!☺
Copyright © Primary Inspiration by Linda Nelson
Permission to copy for single classroom use only.
Please purchase additional licenses if you intend to share this product.


