116 results
3rd grade graphing activities for Easel
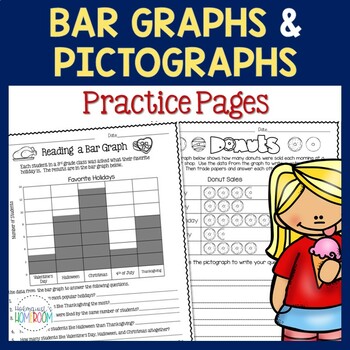
Bar Graphs & Pictographs - 3rd Grade
These bar graph and pictograph pages will give your students extra practice reading, interpreting, and creating bar graphs and pictographs.You may also be interested in my Fall Bar Graphs & Pictographs and Thanksgiving Bar Graphs and Pictographs!UPDATE: There is now a digital version that you can assign to your students in Google Classroom - it's ready to go with answer boxes and directions - all you have to do is assign it through TpT Easel! In the first two activities, students answer ques
Subjects:
Grades:
3rd
Types:
CCSS:
Also included in: Bar Graphs & Pictographs Year Long Bundle
Coordinate Graphing Ordered Pairs Activities - Printable or Google Classroom
Activities and mystery pictures to teach coordinate graphing and ordered pairs so kids can plot points and solve problems on a coordinate plane. Teach your students about graphing in the first quadrant of the coordinate plant with these woodland animal themed pages!**Easy to use for distance learning!** Digital layer already added - Assign in Google classroom with the TpT digital activity tool and kids can draw lines with the pen and enter answers in text boxes.Contents:*Coordinate Plane Vocab A
Grades:
3rd - 5th
Types:
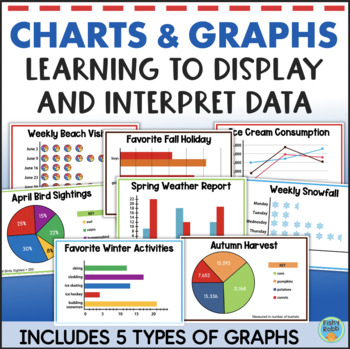
Math Graphing Activities Interpreting Graphs and Data Worksheets Line Pie Bar
Representing and interpreting data using graphs and charts is the focus of this math resource for upper elementary grades. It helps students explore and understand data analysis. For each activity, students will use a graph to answer questions about the data. They will also create another type of graph, chart, or table based on the information provided. This added step really helps students understand the various types of graphs and ways in which data can be displayed.These activities are perfec
Subjects:
Grades:
3rd - 5th
Types:
Also included in: Third Grade Math & Reading YEAR LONG BUNDLE 1500+ Pages
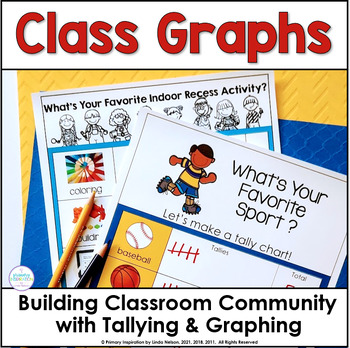
Bar Graphs & Tally Marks - Graphing Math Data to Build Classroom Community
This fun set of graphing activities gives your students lots of relevant practice collecting and interpreting data with ready-to-use bar graphs and tally mark charts. Plus, it builds classroom community and develops meaningful connections! Here's what this graphing and tallying resource includes!➯ 23 one page horizontal and vertical bar graphs designed to build classroom community as your students learn about how they are alike and different. Topics range from favorite foods, sports, and books,
Subjects:
Grades:
K - 3rd
Types:
CCSS:
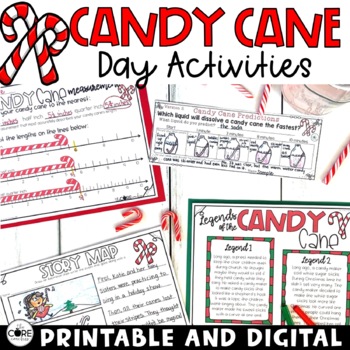
Candy Cane Day Activities - Candy Cane Science - December Themed Lesson Plans
Candy Cane themed activities to engage your students in meaningful learning mixed with fun! These Candy Cane activities are offered in both print and digital so teachers can mix it up to find the perfect balance of versatility that meets the face-to-face and device-based learning needs of a modern classroom.This resource is preloaded to Google Slides and SeeSaw. One click links are provided for the activities on both platforms making it easy to assign to students digitally. Please view the vid
Grades:
1st - 3rd
Types:
Also included in: 12 Days of Christmas Countdown - Christmas Activities Print and Digital
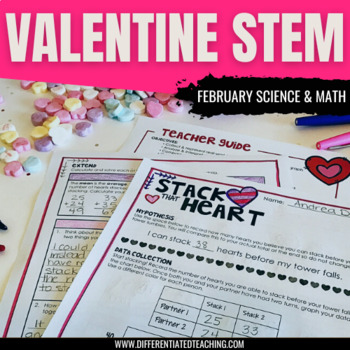
Candy Heart Stacking: Valentines Day Math Activities February STEM Challenge
This hands-on Valentine's Day STEM activity tests students' building skills while reinforcing important mathematical and science concepts. Students work individually or with partners to build the tallest tower using conversation hearts. Then they analyze the data they collected through their trials. A great Valentine's Day activity...or perfect for those conversation heart leftovers later in February!Your purchase includes: Teacher directions with clearly written objectives, materials list, and
Subjects:
Grades:
3rd - 5th
Types:
Also included in: February Activities Bundle: Book Study, Printables, Crafts, & More
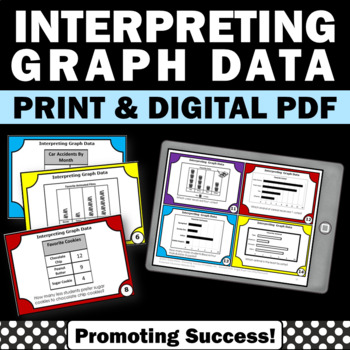
Bar Graph Practice Reading Charts and Graphs Analyzing Data 2nd 3rd Grade Math
Data and Measurement: You will download 30 bar graph task cards for your 2nd, 3rd or 4th grade students to practice reading, analyzing, and interpreting charts and graphs data. They are a great supplement for your 2nd or 3rd grade measurement and data math standards.For your convenience, you will download both TPT digital EASEL and printable PDF resource formats. ☛ Please click on the PREVIEW above.You may use the printable bar graph practice task cards in your math stations or centers for fun p
Subjects:
Grades:
2nd - 3rd
Types:
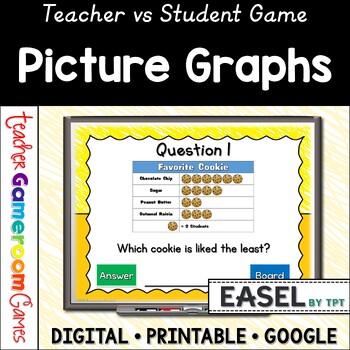
Pictographs Powerpoint Game | Picture Graphs | Digital Resources | Graphs & Data
Pictographs game! Students will answer questions about two picture graphs. Questions include most/least favorites, totals for each group, and comparing groups. There are 2 graphs in this game, each with 10 questions, giving you a total of 20 questions. The question disappears after you've clicked on it, so you know you've answered it. The scoreboard allows you to add scores during Slideshow Mode. Great digital resource for a quick math morning review or center activity. Great for individual prac
Subjects:
Grades:
K - 3rd
Also included in: Graphs Bundle | No Prep Digital Resources
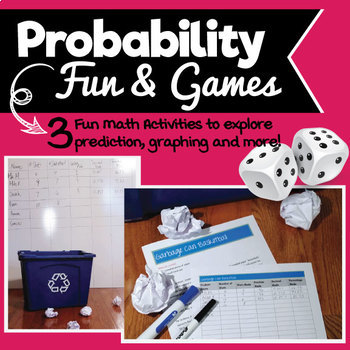
Probability Fun & Games! Exploring fractions, decimals, percentages & more!
Probability Fun & Games reinforces the concepts of: addition, prediction, graphing, fractions, decimals, and percents through three fun activities. Your students will be on the fast track to learning basic math skills. The packet include three activities - Roll Them Bones, Trash Can Basketball and What Color is Your Candy.
Included in this download are:
• Note to teacher with tips on using lessons
• Three activities with instructions
• Discussion prompts
• Ready-made charts for students to
Subjects:
Grades:
3rd - 8th
Types:
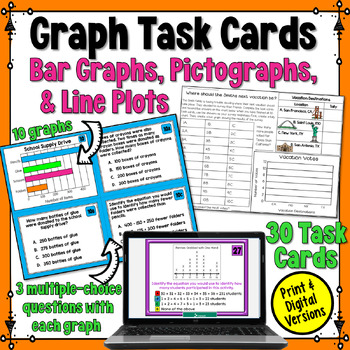
Graphing Task Cards: Scaled Picture & Bar Graphs, Line Plots 3rd Grade Practice
Graphing Task Cards: This set of 30 task cards is designed to give your third-grade students the opportunity to practice solving a variety of graph and data questions written in a multiple-choice format. Students will have many opportunities to interpret various types of graphs. It includes scaled bar graphs in both vertical and horizontal orientations. Scaled picture graphs and line plots are also included. For each graph provided, three questions follow.Students will interact with the data on:
Subjects:
Grades:
3rd - 4th
Types:
Also included in: Graphs Bundle: Scaled Bar Graphs, Pictographs, and Line Plots
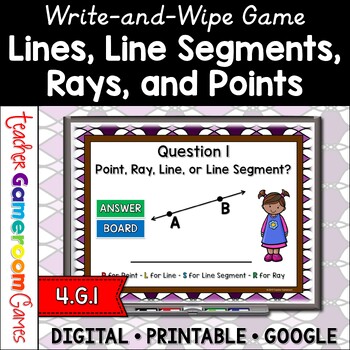
Lines, Segments, Rays, and Points Game | Geometry Activities | Digital Resources
Practice geometric shapes. Students are identifying points, lines, rays, and line segments. Using dry-erase whiteboards, students write S for line segment, L for line, R for ray and P for point. There are 25 questions and you just click on each question to go to it. The question disappears after you've clicked on it so you know you've answered it. Great for a guided math center or test review. Great for individual practice on the iPad! Extra licenses are $1.50. Little to no prep. No setup. No c
Grades:
3rd - 5th
CCSS:
Also included in: Geometry Games Bundle | No Prep Digital Resources
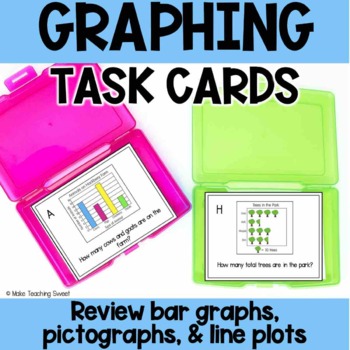
Graphing Task Cards - Interpreting Bar Graphs, Picture Graphs, Line Plots
Interpreting data doesn't have to be boring! Add these engaging task cards to your graphing unit! The task cards review bar graphs, pictographs, and line plots using these graphing task cards! Perfect to use as a whole group review, with a small group or in a math center. Teaching students to analyze data on graphs can be such a fun unit - but using the same graphs gets boring! Each task card features a different graph so your students will have a fun, hands-on way to practice reading graphs an
Subjects:
Grades:
1st - 4th
Types:
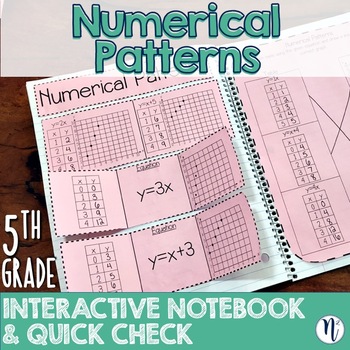
Numerical Patterns Interactive Notebook Activity & Quick Check TEKS 5.4C 5.4D
This interactive notebook activity and quick check assessment covers TEKS 5.4C: Generate a numerical pattern when given a rule in the form y=ax or y=x+a and graph and TEKS 5.4D: Recognize the difference between additive and multiplicative numerical patterns given a table or graphNote: These interactive notebook activities were designed to be completed on paper. However, I have enabled the “TpT Digital” option in case teachers want to convert the quick check assessment page and assign to their di
Subjects:
Grades:
3rd - 5th
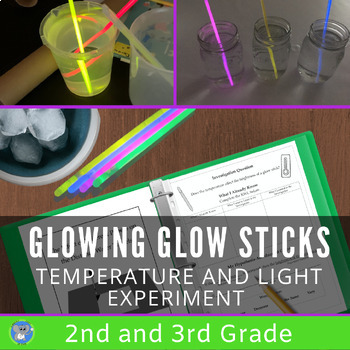
Chemical Reactions Glow Stick Science Experiment | Investigate Light | Grade 2 3
Excite students by investigating the speed of a chemical reaction using glowsticks. This experiment uses simple supplies, includes detailed directions to guide the teacher and students, and creates a memorable experience. NGSS Aligned, fun, and perfect for Halloween.Students will learn about chemiluminescence and chemical reactions. They will use data and observations to write a conclusion. Students will follow the scientific method to answer the question: Does temperature affect the brightne
Subjects:
Grades:
2nd - 5th
Types:
NGSS:
3-5-ETS1-3
, 2-PS1-4
, 2-PS1-1
, 2-PS1-3
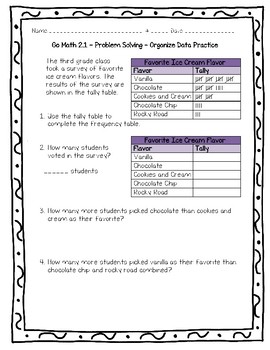
Go Math Practice - 3rd Grade Chapter 2 - Represent and Interpret Data
What's Included
Included in this pack are 9 worksheets on all the lessons in the Go Math book for chapter 2, a midchapter checkpoint practice sheet, and an end of the chapter checkpoint practice sheet.
I try to make each one 10 questions and on 1 page but due to the nature of this chapter (graphs and charts) there may be more or less.
These can be used as a quiz, formative assessment, homework, or just extra practice!
Answer keys are included for each worksheet.
Lesson 1: Problem Solving
Subjects:
Grades:
2nd - 4th
Types:
Also included in: Go Math Practice - 3rd Grade Worksheets For Entire Year Bundle
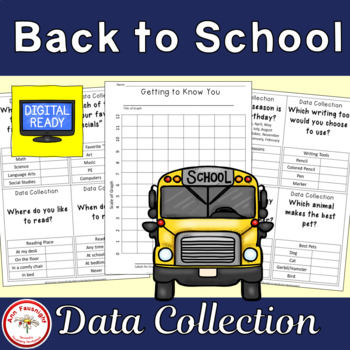
Back to School Getting to Know You Data Collections and Graphs
This product is ready for distance learning. Check out the TpT Digital Activity button. I have already created a student-friendly digital activity with directions and answer boxes that can be used through Google Classroom.This packet has 28 different questions about Back to School for students to use for data collection. The questions are on ¼ of a page, so that the teacher only needs to use up to 7 sheets of paper for this part of the activity. A blank sheet is also included for your own ideas.
Subjects:
Grades:
3rd - 5th
Also included in: Back to School Bundle
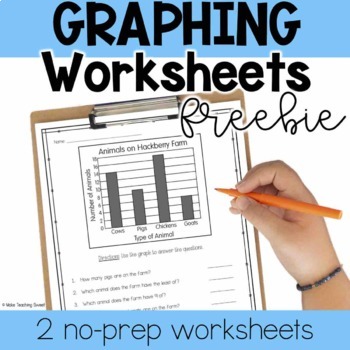
Graphing Worksheets - Interpreting Bar Graphs and Picture Graphs - Freebie!
Ready to review bar graphs & picture graphs in your graphing unit? These 2 no-prep black & white worksheets are perfect to see what students can do! Practice reading & analyzing bar graphs and picture graphs. Use as independent practice, as a math center, a formative assessment, or however you choose!Choose the worksheet that your students need - this freebie makes it easy to differentiate! This file includes a graph with a scale of 2 for early learners, as well as a graph with a sc
Grades:
1st - 4th
Types:
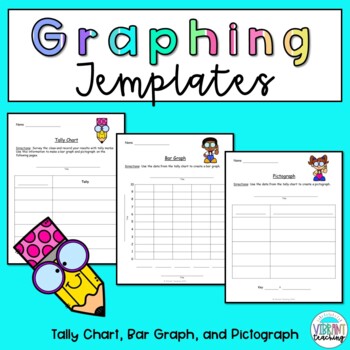
Graphing Templates: Tally Chart, Bar Graph, and Pictograph
Use these graphing templates to create a tally chart, bar graph, and pictograph. Students will be so excited to choose a topic, complete a survey, and record their data on these graphs. Each activity comes in color and black and white. The color copy is great to project on the board to do a class example first.Digital Learning:Includes a digital version using the TPT Digital Activity Tool. Text boxes have already been inserted so students can easily type their responses. You can also edit the
Grades:
1st - 3rd
Types:
Also included in: Graphing Worksheets: Tally Chart, Bar Graph, and Pictograph
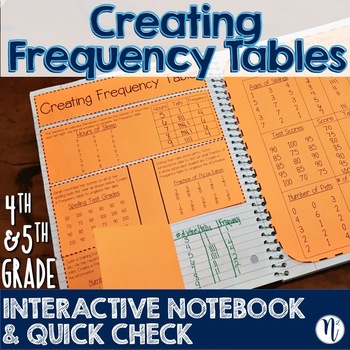
Creating Frequency Tables Interactive Notebook & Quick Check TEKS 4.9A & 5.9A
This interactive notebook activity and quick check assessment covers creating frequency tables under TEKS 4.9A: Represent data on a frequency table, dot plot, or stem‐and‐leaf plot marked with whole numbers and fractions and TEKS 5.9A: Represent categorical data with bar graphs or frequency tables and numerical data, including data sets of measurements in fractions or decimals, with dot plots or stem‐and‐ leaf plotsNote: These interactive notebook activities were designed to be completed on pape
Subjects:
Grades:
3rd - 5th
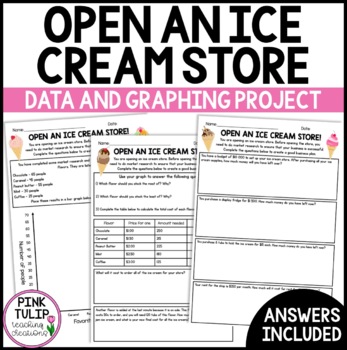
Open An Ice Cream Shop - Graphing and Data Math Activity
Open An Ice Cream Shop - Graphing and Data Math ActivityExtend understanding of graphing and data displays with this maths activity. This project is a great extension for early finishers, or the perfect assignment to implement at the end of a graphing and data module.This project encompasses a broad range of real-life mathematical skills, including budgeting and the four processes. It also requires students to research and price items for their store.This activity was designed to be used as a
Subjects:
Grades:
3rd - 6th
Types:
Also included in: Custom Order Resource Bundle #2
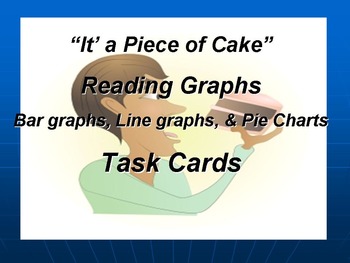
Task Cards Reading Graphs: Line Graphs, Bar Graphs, and Pie Chart: Revised
40 Task Cards. Teach your students how to read and interpret a line graph, bar graph, or pie chart from a word problem or given data. Challenge your students to think more critically and become better mathematicians. Start your students on their
way to becoming better problem graphic interpreters.
A teachers guide entitled “Learn to Read Graphs” is included. An answer guide for each activity is also provided.
Some common core standards met by this activity will be:
CCSS.Math.
Subjects:
Grades:
3rd - 9th, Adult Education
Types:
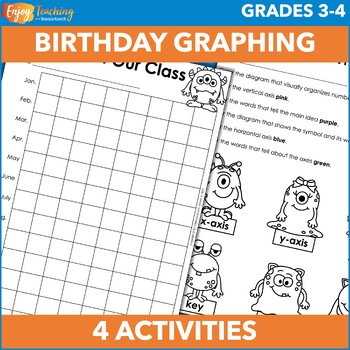
Birthday Pictograph, Bar Graph, Frequency Table & Line Plot Activities
Make graphing fun with birthdays! Together, kids create human and picture graphs. Then each child makes a bar chart. As a bonus, they can also crunch the data in frequency tables and display it on a line plot. Open the preview to take a closer look at the math activities.First, create a human graph. Ask kids to line up against a wall according to birth month. There’s only one catch: no talking! When you’re done, with a bird’s eye view, you’ve created a graph!Second, work together to build a pict
Subjects:
Grades:
3rd - 4th
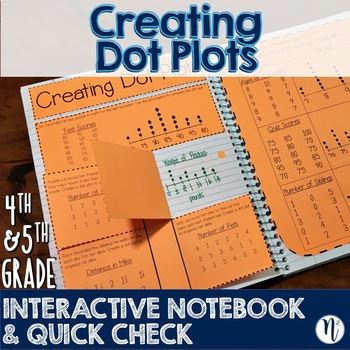
Creating Dot Plots Interactive Notebook Activity & Quick Check TEKS 4.9A & 5.9A
This interactive notebook activity and quick check assessment covers creating dot plots under TEKS 4.9A: Represent data on a frequency table, dot plot, or stem‐and‐leaf plot marked with whole numbers and fractions and TEKS 5.9A: Represent categorical data with bar graphs or frequency tables and numerical data, including data sets of measurements in fractions or decimals, with dot plots or stem‐and‐ leaf plotsNote: These interactive notebook activities were designed to be completed on paper. Howe
Subjects:
Grades:
3rd - 5th
CCSS:
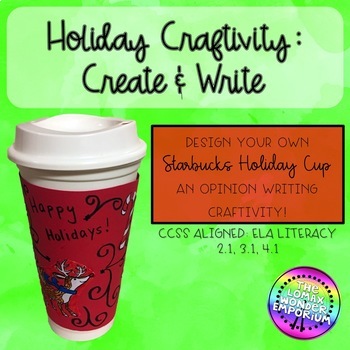
Christmas Holiday Craftivity - Create a Holiday Cup Opinion Writing
Students will design and create a holiday-themed Starbucks cup. They will then write an opinion piece about why their design is the best! Students, another class, or an administrator can vote and be the judge to decide on a winner or you can let everyone be a winner! A full preview is available to help you decide if this activity will be a good fit for your classroom.Standards Addressed: CCSS ELA: Literacy 2.1, 3.1, 4.1What You Get★ Directions for set up★ Information about the Starbucks Holiday
Grades:
2nd - 5th
Types:
Showing 1-24 of 116 results


