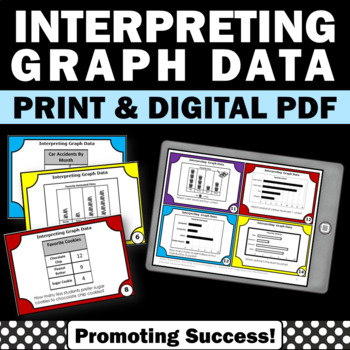
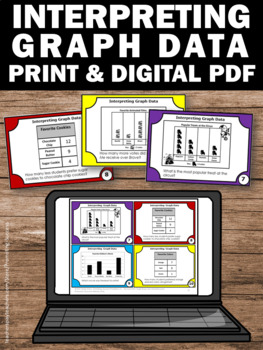
Bar Graph Practice Reading Charts and Graphs Analyzing Data 2nd 3rd Grade Math
- PDF
- Internet Activities
- Easel Activity
What educators are saying
Description
Data and Measurement: You will download 30 bar graph task cards for your 2nd, 3rd or 4th grade students to practice reading, analyzing, and interpreting charts and graphs data. They are a great supplement for your 2nd or 3rd grade measurement and data math standards.
For your convenience, you will download both TPT digital EASEL and printable PDF resource formats.
☛ Please click on the PREVIEW above.
You may use the printable bar graph practice task cards in your math stations or centers for fun practice or review games and activities, such as a scavenger hunt or SCOOT. They also work well for transition activities, as exit tickets, for morning work, homework, bell work, early finishers, test prep, emergency sub plans, and as quick formative assessments. Game ideas, a student response form, and answer key are included.
✔︎ Common Core Standards Lesson Plan:
CCSS.MATH.CONTENT.2.MD.D.10
Draw a picture graph and a bar graph (with single-unit scale) to represent a data set with up to four categories. Solve simple put-together, take-apart, and compare problems using information presented in a bar graph.
CCSS.MATH.CONTENT.3.MD.B.3
Draw a scaled picture graph and a scaled bar graph to represent a data set with several categories. Solve one- and two-step “how many more” and “how many less” problems using information presented in scaled bar graphs. For example, draw a bar graph in which each square in the bar graph might represent 5 pets.
If you prefer these cards in BOOM format, please click HERE.
➥ Click HERE to go back to my storefront and browse the categories on the left.
▶︎ DIGITAL COMPATIBLE RESOURCE:
- Through the EASEL by TPT platform, you will be able to annotate and customize the PDF using overlays. Underlying content is not editable. You will then be able to assign chosen pages to your students.
▶︎ TERMS OF USE:
- Single classroom use only.
- Password protected classroom websites only, not to be found on Google search.
- No commercial use, including Outschool, etc. Contact me if you need a commercial use license.
- No reselling in any digital or print formats.
- Click HERE to see my most current terms of use.
⚙️ CUSTOMER TIPS:
- Click HERE to sign up for my newsletter with flash freebies, secret sales, and more!
- Click on the ★ above to follow my store. You will receive email notifications from TPT of newly listed products and freebies.
- Leave feedback to earn TpT credit points to save money on future products.
Thank you so much for all you are doing for kids!
❤️ Shelly Anton
Promoting Success for You and Your Students!
Bar Graph Practice Reading graphs Charts and Graphs Analyzing graphs measurement and Data 2nd grade measurement interpreting graphs


