708 results
3rd grade graphing lesson pdfs
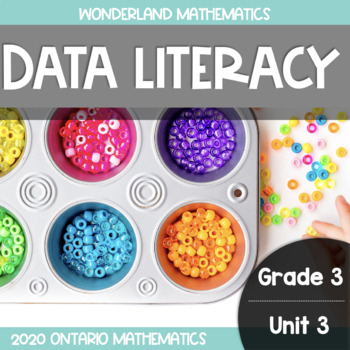
Grade 3, Unit 3: Data Literacy (Ontario Math)
Grade 3, Unit 3: Data Literacy is a 150+ paged resource designed to meet the Ontario 2020 Mathematics curriculum expectations for the Data strand. This resource includes lessons, activities, and assessments that introduce students to bar graphs, pictographs, frequency tables, and sorting using three attributes. Please note this is a printable resource. There is NO Google Slide component to this resource.Wonderland Math is a math unit series designed to meet the Ontario 2020 Mathematics curriculu
Subjects:
Grades:
3rd
Types:
Back to School MEGA Pack! {Grades 1-3}
This 89 page pack is FULL of engaging activities, printables and craftivities that are perfect to use those first couple of weeks with your new students! Activities are geared for grades 1-3. **DOWNLOAD THE PREVIEW FOR A PEAK AT MOST PAGES!**
There are activities to go along with the following books:
-Chrysanthemum
-Have You Filled a Bucket Today?
-Wemberly Worried
-I Like Myself!
-The Crayon Box That Talked
-A Bad Case of Tattle Tongue
Table of Contents:
Pg. 3: List of books needed
Pg.
Grades:
1st - 3rd
Types:
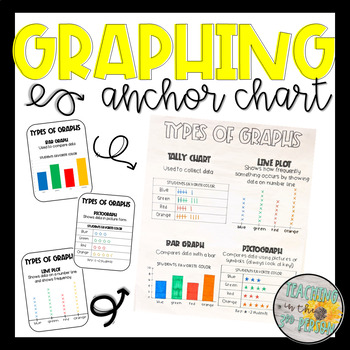
Types of Graphs Anchor Chart - Tally Chart, Bar Graph, Pictograph, Line Plot
Graphing made easy!Use these templates as a guide in creating your own anchor charts or print and use them in other helpful ways:Trace and create an anchor chart with studentsPrint on bright colored paper and use as postersShrink down and glue in student' math notebooks for a reference sheetPrint and send home as reference tools for students and parents (homework or tutoring)Earn Credit for Future Purchases:I appreciate each & every word of your valuable feedback. Also, if you leave feedback
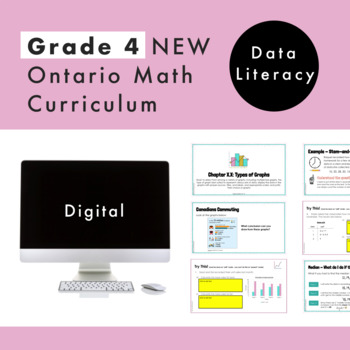
Grade 4 Ontario Math - Data Literacy Curriculum - Digital Google Slides + Form
Are you planning for the NEW Grade 4 Ontario Math Curriculum? This editable Google Slide resource is what you need! This resource is for the DATA strand and covers ALL specific expectations for “D1. Data Literacy”. In this resource, students will experience math through engaging real-life questions, storytelling through math, and interactive slides. What’s Included6 Google Slide presentations147 UNIQUE and EDITABLE Google Slides in totalSlides are editable for you to increase student engagemen
Subjects:
Grades:
3rd - 5th
Types:
Also included in: Grade 4 NEW Ontario Math Curriculum Full Year Digital Slides Bundle
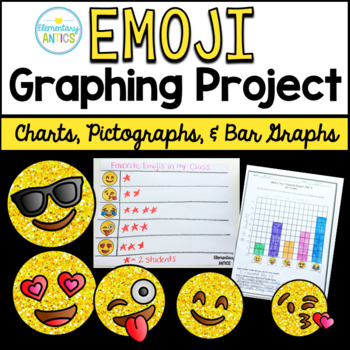
Emoji Graphs and Data Project {Charts, Pictographs, Bar Graphs}
This fun graphing project is a great way to introduce your students to collecting data and graphing- and the emojis keep them engaged and excited about learning!The Emoji Graphing Project includes 3 days of lesson plans!Part One: Conducting the SurveyPart Two: Making a Picture GraphPart Three: Create a Bar GraphAdditional Graphing Practice (3 more worksheets)Simple lesson plans are included for each part, but there is a ton of flexibility on how you can use this project in your classroom since y
Subjects:
Grades:
2nd - 3rd
Types:
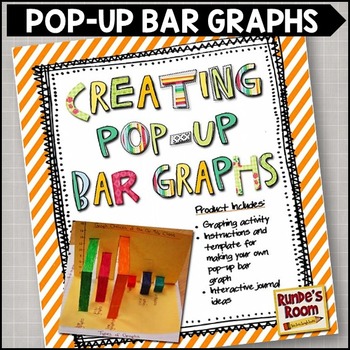
Bar Graph Activity 3D Graphing Assignment
Make your data management and graphing lessons stand up and out with 3D pop-up bar graphs! These 3D bar graphs can be added to your interactive notebooks or display on their own for any data activity you complete.This resource includes: •2 different bar graph activities (one with intervals and one without)•student handouts•instructions on how to build a 3D pop-up bar graph (that can be adapted to any bar graph activity)•interactive journal ideas•student reflection ideasPictures of completed exa
Grades:
3rd - 6th
Types:
Also included in: Graphing and Data Activity Bundle for Upper Grades
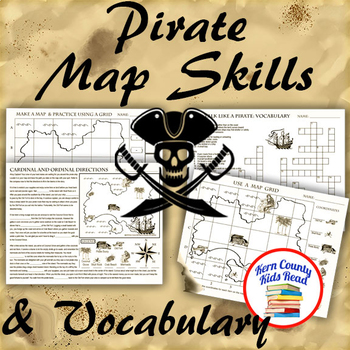
Pirate Map Skills: Grid Coordinates, Cardinal & Ordinal Directions, Symbols
Teach and strengthen coordinate grid math, geography mapping skills like map symbols and cardinal and ordinal directions with a compass rose, and new vocabulary with these pirate themed printable worksheets. These are fun mini-lesson activities for Talk Like A Pirate Day on September 19th or if you have a pirates themed unit. Cardinal directions and coordinate grid mapping are important introductory skills to mastering latitude and longitude map skills and being able to use an atlas. Coordinate
Subjects:
Grades:
3rd - 6th
Also included in: Pirates Thematic Unit Study Bundle: Talk Like A Pirate Pack!
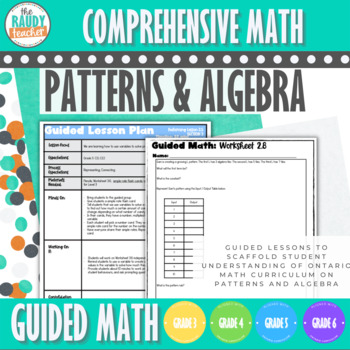
Ontario Guided Math Unit - PATTERNING -Patterns & Algebra - Grades 3,4, 5, 6
Make teaching Patterns and Algebra fun with these differentiated lessons and activities! This FULL UNIT includes 4 pathways with differentiated lessons PATTERNS.. It helps you identify and target student gaps in their patterning.This is FULLY aligned with the New Math Curriculum 2020 - and supports Grades 3-6! PERFECT FOR ALL OF THESE GRADES OR DIFFERENTIATION! This unit is full of Assessment For and Assessment As Learning tasks that fulfill expectations in B NUMBER Strand in the New Ontario Mat
Grades:
3rd - 6th
Types:
Also included in: Ontario Guided Math BUNDLE - 8 UNITS - ALL STRANDS - Grades 3, 4, 5, 6
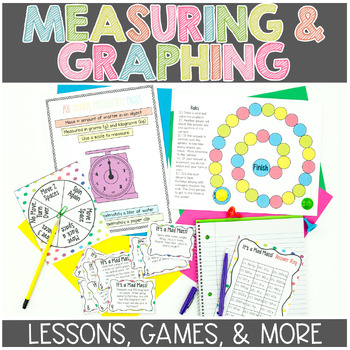
Measuring Mass Volume Graphing Activities | Lessons | Guided Math Workshop
This graphing math workshop unit covers an array of graphing skills, such as bar graphs, picture graphs (or pictographs), line plot graphs, and the measurement of mass and liquid volume (capacity). This unit is based off of third grade standards 3.MD.2, 3.MD.3, and 3.MD.4 with many hands-on activities in the guided math and math workshop model.Check out the preview for details!Save 20% when you buy the 3rd Grade Math Workshop for the ENTIRE Year BUNDLE! It has everything you need for the entire
Subjects:
Grades:
3rd
Types:
Also included in: 3rd Grade Year Long Full Year Curriculum Guided Math Curriculum BUNDLE
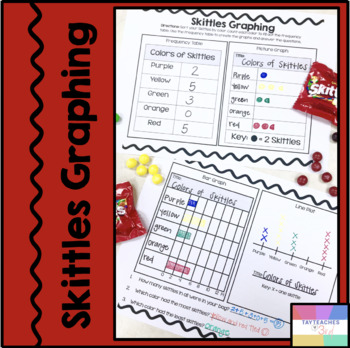
Skittles Graphing-Bar Graph, Line Plot, Picture Graph
This is a super fun activity to go along with your graphing unit. My students really struggle with following the key on a picture graph, so this was great practice! Includes: -2 Pages (to be printed front and back) Frequency Table (students sort skittles and fill in the table) Picture Graph, Key is counting by 2's, Students practice filling in the graph titles and pictures (some pictures will need to show half a skittle for odd number counts)Bar Graph, Scale is counting by 2's Line Plot Data Ana
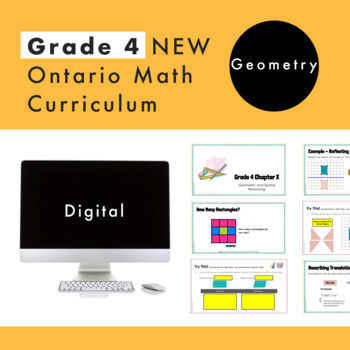
Grade 4 Ontario Math - Geometry Curriculum - Digital Google Slides + Form
Are you planning for the NEW Grade 4 Ontario Math Curriculum? This editable Google Slide and Google Form resource is what you need! This resource is for the SPATIAL SENSE strand and covers ALL specific expectations for “E1 Geometric and Spatial Reasoning”. In this resource, students will experience math through engaging real-life questions, storytelling through math, and interactive slides. What’s Included4 Google Slide presentations95 UNIQUE and EDITABLE Google Slides in totalSlides are edita
Grades:
3rd - 5th
Types:
Also included in: Grade 4 NEW Ontario Math Curriculum Full Year Digital Slides Bundle
Calendar Math: 3rd Grade Workbook {Everyday Counts Aligned}
UPDATE: This growing-product is officially complete and uploaded! All months August/September - May/June are here! YAY! Enjoy! (re-download your purchase if you bought this product at a discount as it was growing throughout 2015 - 2016)
This Calendar Math Yearlong Student Workbook is PACKED with math skills you already teach during your calendar routines. This product gives your students the opportunity prove what they are learning by interacting with their very own Calendar Math Workbook!
*I
Subjects:
Grades:
3rd
Types:
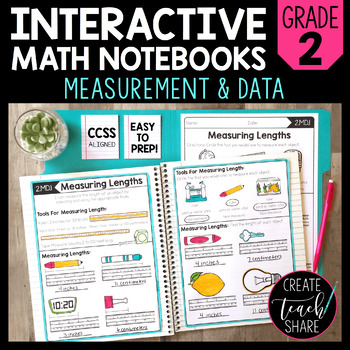
Math Interactive Notebook 2nd Grade Measurement and Data
What are Interactive Math Notebooks?
Interactive math notebooks are teaching pages used to introduce and teach new math concepts and skills. Each set of notebook pages includes definitions, explanations, rules, and/or algorithms that may be needed to address each standard. Sample and practice problems are also included to be used for guided practice. Once completed, these notebook pages serve as anchor charts for students to refer back to as a reference tool throughout the year.
How do I use
Subjects:
Grades:
1st - 3rd
Also included in: Math Interactive Notebook 2nd Grade Bundle
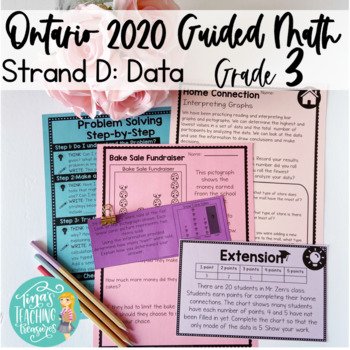
Ontario Grade 3 Math 2020 Curriculum: Data : Graphing, Mean & Mode, Probability
Fully updated to align with the 2020 Ontario Math Curriculum!Please download to get the 2020 curriculum updates including over 50 more PAGES!!! This PRINTABLE product is designed to make your grade 3 Ontario math program simple, effective, and engaging! Keep your students learning with three-part lessons and lots of practice. All expectations for Strand D: Data (Graphing & Probability). 1. Sorting2. Creating Graphs3. Interpreting Graphs4. Mean and Mode5. ProbabilityEach set includes:Teac
Subjects:
Grades:
3rd
Types:
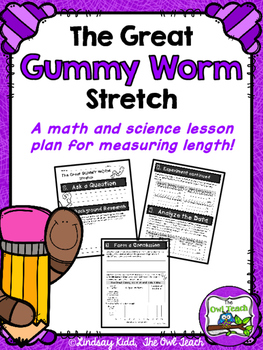
Measuring Length: {Measurement Science and Math Lab Activity}
This Measuring Length Activity is a hands-on, math and science integrated LAB, which takes students through the scientific method to measure the length of two different types of gummy worms in customary and metric units to see which type of candy worm stretches the greatest amount overall! This is easy to follow, fun, and a great way to practice measurement and data standards!
Included in this Packet:
-Teacher Directions (2 pages)
-Student Lab Sheet (4 pages)
-Grading Rubric (1 page)
Measurin
Subjects:
Grades:
1st - 4th
Types:
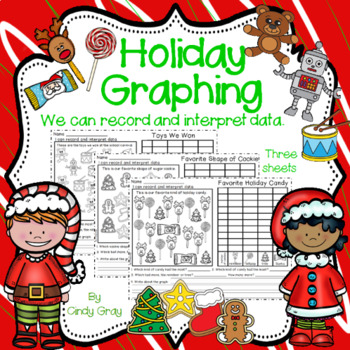
Holiday Graphing ~ Record and Interpret Data ~ Christmas Themed
Fun Christmas themed graphing activities to help students record and interpret data. Included are three students sheets. On each sheet, the students are asked to record the data provided, answer questions about the graph and finally to write something about the graph.For similar graphing activities Graphing ~ Record and Interpret DataBack To School Graphing ~ Record and Interpret DataHalloween Graphing ~ Record and Interpret Data ~ Set 1Halloween Graphing ~ Record and Interpret Data ~ Set 2Day
Subjects:
Grades:
1st - 3rd
Types:
CCSS:
3rd Grade Lesson Plans Data Analysis TEKS 3.8A
Complete Lesson Plans for Data Analysis. This unit teaches TEKS 3.8A- Summarizing data using a frequency table, dot plot, pictograph and bar graph. Scaled intervals lessons and interventions are included!I have broken down each TEK into Learning Targets to make it easier to track student progress. There are 4 skills in this unit! A student data sheet is included for students to reflect on their own learning for the unit. A teacher tracking sheet is included to make small group instruction easi
Grades:
3rd
Types:
CCSS:
Also included in: 3rd Grade Math Yearlong Bundle Follows TEKs
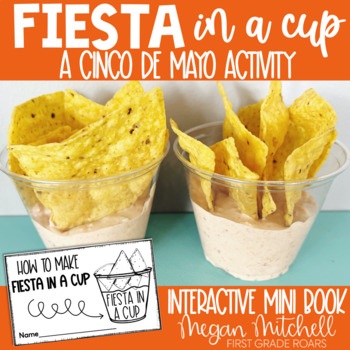
Fiesta in a Cup a Cinco De Mayo Activity
Are you looking for a fun treat to do with your class for Cinco De Mayo or any time of year? Fiesta in a cup is the perfect snack to make with your students. You can use the mini book provided to follow the directions to make this no bake taco dip. While you make it, you will read directions, work on teamwork and end up with something delicious. Your students can also predict, survey, graph, sequence and do a little math with their data. In addition, there is a fun fiesta in cup craft, class
Grades:
K - 3rd
Types:
Also included in: Seasonal Snack Activities in a Cup Growing Bundle
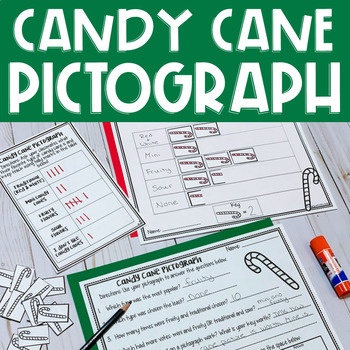
Candy Cane Pictograph - Christmas Graphing
Do you need a fun way to practice pictographs or graphing? I love this hands-on graphing activity because it's engaging and gets students up and moving! Plus it's perfect to use during the Christmas season or the last week before Christmas break!This product is an easy way to practice making pictographs (specifically geared toward the 3rd grade classroom)! I know that sometimes understanding pictographs can be confusing for students-- so I like to use this "make your own" graph to help them take
Subjects:
Grades:
2nd - 4th
Types:
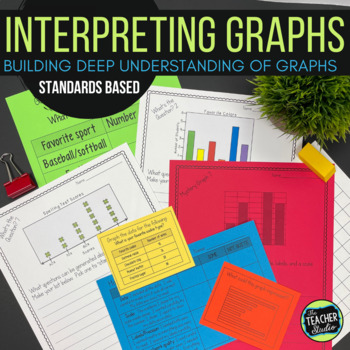
Graphs and Interpreting Graphs Activities - Hands On Data Investigations
What IS this graphing resource? These are NOT your typical graphing activities...and they are not just "busy work" for students--these graphing lessons are meant to be collaborative, instructional, rigorous, and FUN! Students need to have experience creating and interpreting graphs, so we need graphing lessons that are more than fill-in-the-blank worksheets. That's how we get students to understand that data has a purpose and that graphs show that data well.This resource includes opportunities
Measurement and Line Plots Math Unit - 3rd grade
Measurement and Line Plots: Measurement to the Quarter Inch & Understanding Line Plots and Measurement Math UnitThese lesson plans cover the following concepts: -measuring length to the nearest whole inch-measuring length to the nearest half inch-why we include whole inches when measuring to the nearest half inch-measuring length to the nearest quarter inch-why we include half and whole inches when measuring to the nearest quarter inch-measurement reteaching lesson/ activity/ worksheets-meas
Subjects:
Grades:
3rd
Types:
CCSS:
Also included in: Third Grade Common Core Measurement Bundle
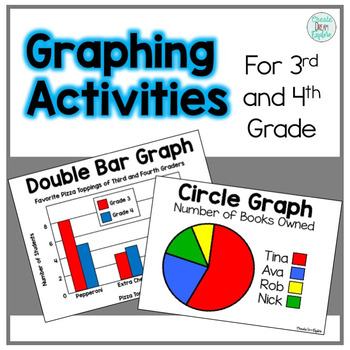
Graphing Activities for 3rd and 4th Grade
This is a set of graphing activities to use with your students. Included in this pack are:-An introduction to graphing activity.-Open response activity for organizing data.-Color and black and white graph posters for display purposes (circle graph, bar graph, double bar graph, line plot, line graph, pie graph, histogram, pictograph-Water Bottle Flip Challenge graphing activity (demonstrating double bar graphs)-Water bottle flip challenge - find the mode and then find the median-Create your own g
Grades:
3rd - 4th
Types:
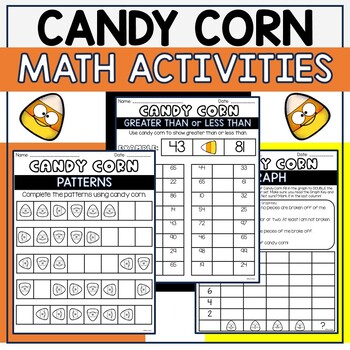
Candy Corn Math Activities
Candy Corn Math is a great seasonal activity to use for your students! These activities are engaging, great for review, and helpful in small groups! Skills Included:PatternsAdditionSubtractionArraysWord ProblemsRoundingGraphingNeed Another Fall Resource? Check Out My FALL BUNDLE!Hillary's Teaching Adventures Terms of UseProducts by Hillary's Teaching Adventures, LLC may be used by the purchaser for their classroom use only. This is a single classroom license only. All rights reserved.©Hillary's
Subjects:
Grades:
2nd - 4th
Types:
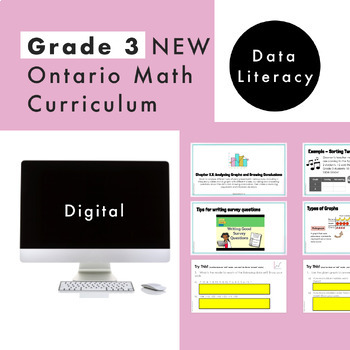
Grade 3 Ontario Math - Data Literacy - Digital Google Slides + Form
Are you planning for the NEW Grade 3 Ontario Math Curriculum? This editable Google Slide resource is what you need! This resource is for the DATA strand and covers ALL specific expectations for “D1. Data Literacy". In this resource, students will experience math through engaging real-life questions, storytelling through math, and interactive slides. What’s Included6 Google Slide presentations149 UNIQUE and EDITABLE Google Slides in totalSlides are editable for you to increase student engagemen
Subjects:
Grades:
2nd - 4th
Types:
CCSS:
Also included in: Grade 3 NEW Ontario Math Curriculum Full Year Digital Slides Bundle
Showing 1-24 of 708 results


