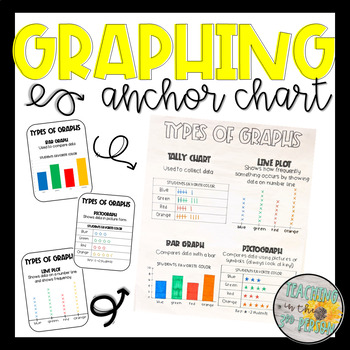
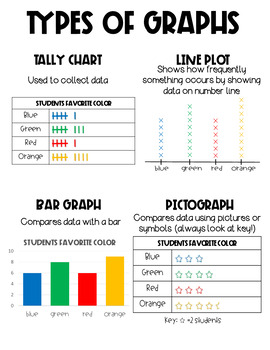
Types of Graphs Anchor Chart - Tally Chart, Bar Graph, Pictograph, Line Plot
Teaching in the 3rd Person
280 Followers
Resource Type
Standards
CCSS2.MD.D.9
CCSS2.MD.D.10
CCSS3.MD.B.3
CCSS3.MD.B.4
CCSS4.MD.B.4
Formats Included
- PDF
Pages
10 pages
Teaching in the 3rd Person
280 Followers
What educators are saying
This was very helpful to use to help review the different types of graphs! My students used this as a guide to help them make their own graphs given a set of data.
I used this resource to review the different types of graphs. This helped students remember the different components. This resource was very useful.
Description
Graphing made easy!
Use these templates as a guide in creating your own anchor charts or print and use them in other helpful ways:
- Trace and create an anchor chart with students
- Print on bright colored paper and use as posters
- Shrink down and glue in student' math notebooks for a reference sheet
- Print and send home as reference tools for students and parents (homework or tutoring)
Earn Credit for Future Purchases:
I appreciate each & every word of your valuable feedback. Also, if you leave feedback on this product you can get TPT credits that help lower the cost of future purchases. Thank you so much in advance.
I would love to see this resource being used in your classroom!
Tag @teachinginthe3rdperson in your post or story!
Thanks-Katlyn Seaver
Total Pages
10 pages
Answer Key
N/A
Teaching Duration
N/A
Report this resource to TPT
Reported resources will be reviewed by our team. Report this resource to let us know if this resource violates TPT’s content guidelines.
Standards
to see state-specific standards (only available in the US).
CCSS2.MD.D.9
Generate measurement data by measuring lengths of several objects to the nearest whole unit, or by making repeated measurements of the same object. Show the measurements by making a line plot, where the horizontal scale is marked off in whole-number units.
CCSS2.MD.D.10
Draw a picture graph and a bar graph (with single-unit scale) to represent a data set with up to four categories. Solve simple put-together, take-apart, and compare problems using information presented in a bar graph.
CCSS3.MD.B.3
Draw a scaled picture graph and a scaled bar graph to represent a data set with several categories. Solve one- and two-step “how many more” and “how many less” problems using information presented in scaled bar graphs. For example, draw a bar graph in which each square in the bar graph might represent 5 pets.
CCSS3.MD.B.4
Generate measurement data by measuring lengths using rulers marked with halves and fourths of an inch. Show the data by making a line plot, where the horizontal scale is marked off in appropriate units-whole numbers, halves, or quarters.
CCSS4.MD.B.4
Make a line plot to display a data set of measurements in fractions of a unit (1/2, 1/4, 1/8). Solve problems involving addition and subtraction of fractions by using information presented in line plots. For example, from a line plot find and interpret the difference in length between the longest and shortest specimens in an insect collection.


