25 results
3rd grade graphing rubric pdfs
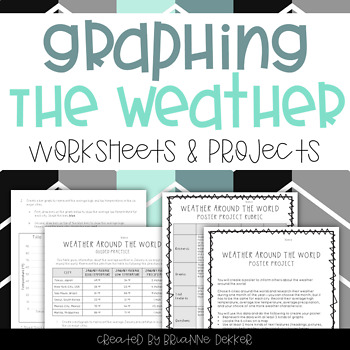
Graphing the Weather - Worksheets and Projects
This product contains science and math graphing worksheets and projects for a unit on weather. These resources were created with NGSS content and evidence statements in mind.
The first set of worksheets focus on weather around the world, and the second set focus on weather patterns in one area. Each set contains guided practice, in which students are given data and asked to create different types of graphs to represent the data; independent practice, in which students must gather data and then
Subjects:
Grades:
3rd - 5th
Types:

Fluency Graphs (Monster Readers Theme)
Monster Readers Fluency Graphs--
Monitor your monster readers' fluency progress!
Great for record-keeping and data management!
In this packet, you will find:
* About Fluency & Tracking Progress (basic facts)
* Background Info on Timed Reading, Target Charts & Recording Sheets
* 5 Different Graphs: 60, 100, 120, 150 plus blank one to write in goal targets
* A class profile sheet
* Fluency Rubric
* Fun partner recording sheets
* 2 Award Sheets for meeting goals (one color, one b/w--half
Subjects:
Grades:
K - 4th
Types:
Also included in: Reading and Writing Super Mega Bundle Deal
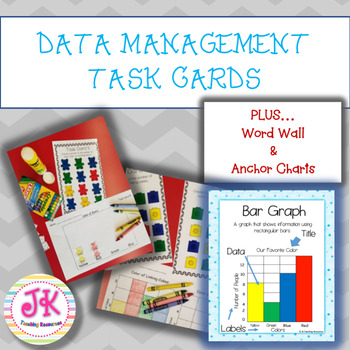
Data Management & Analysis Bundle-Pictograph | Bar Graphs | Tally Marks |
This data management bundle is loaded with over 40 pages of task cards, anchor charts, rubrics AND a word wall! All of which requires very little to NO PREP! It was designed to help teachers teach, reinforce, practice, and assess students’ understanding of the data management/analysis unit.Our focus was on Grade 2, 3 and special education classrooms when we made this product but it does align with Kindergarten and Grade 1 standards or make a good review in elementary classrooms. Especially for b
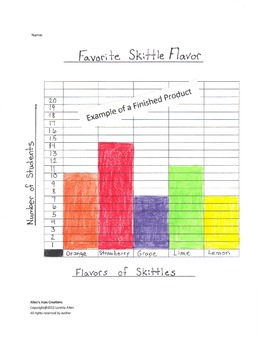
Bar Graphing - Skittles Candy
Students will taste test each Skittles Candy flavor, and then ask their classmates their favorite flavors and record the data collected. Then they use their data to create a bar graph. I use this in my 3rd grade class and it is always a big hit activity!
Subjects:
Grades:
2nd - 6th
Types:
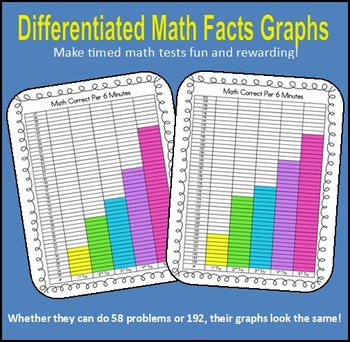
Differentiated Math Facts Graphs
These "Differentiated Math Facts Graphs" allow the kids to graph the scores of their timed math facts tests. The visual encourages students to work towards beating their own scores.
I've found that my students do not compare graphs based on the tiny numbers to the side, but rather by whose bar is tallest or who made the most growth. This allows even the struggling students to be recognized and feel great for their hard work!
Can be used with addition, subtraction, multiplication, or divisi
Subjects:
Grades:
1st - 4th
Types:
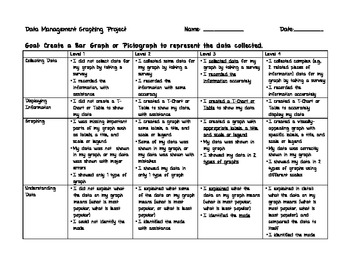
Grade 3 Graphing Project Rubric - Ontario
This is marking rubric for a Grade 3 Graphing project - based on Ontario curriculum. It would be for a final project. I have also included a student checklist - for students to use as they create their work to ensure they are meeting the expectations. The preview shows a project one student created, at the Grade 5 level. He left the bottom empty to print out a picture of LeBron.The project I did:Students created a survey question and collected data from their classmates.Students recorded the inf
Grades:
3rd
Types:
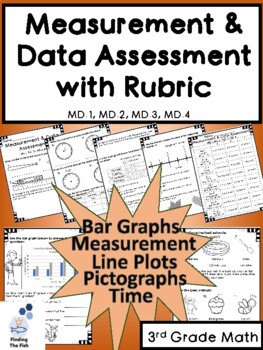
3rd Grade MD Assessment with Rubric: Graphs, Time, Measurement, Volume, Mass
Students will show what they know about time, elapsed time, measurement in inches, volume, mass, bar graphs, pictographs, and line plots. Each bar graph, pictograph, and line plot has questions for students to interpret the data on the graph. Students will use the ruler to measure items to the nearest quarter inch. Students will looks at clocks and tell the time, then use given times to figure out the elapsed time. They will also use their best judgement on mass and volume measurements. This as
Subjects:
Grades:
3rd
Types:
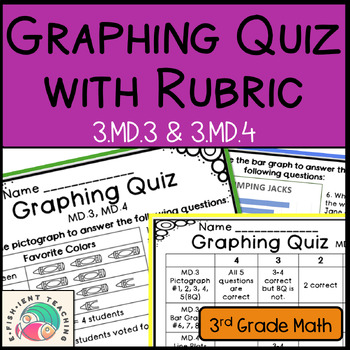
Graphing Quiz: 3rd Grade Measurement & Data: Bar Graphs, Pictographs, Line Plots
3rd grade core Graphing Quiz. Are you ready to see what your students have learned about graphs? This quiz covers bar graphs, pictographs, and line plots. Students will show their knowledge of reading graphs and interpreting what they mean. This graphing quiz comes with answer keys to make grading easy. It also comes with a standards based rubric. This rubric is on a scale of 1-4. Each question on the quiz correlates with a 3rd grade math standard making grading easy.Use this quiz to assess the
Subjects:
Grades:
2nd - 3rd
Types:
The Great Pumpkin Patch Math Adventure
Wow! Lots of fun combined with lots of math, reading, and science. A perfect recipe for learning! This is one of my favorite fall Project Based Learning math activities to do with my class. The students are so busy having fun, they don't realize how much math they are learning! Students work cooperatively to make estimates about the height, weight, circumference, no. of seeds, and cost of their pumpkin at the Estimation Station. Then they will have fun finding the actual data on their pumpkins.
Subjects:
Grades:
3rd - 5th
Types:
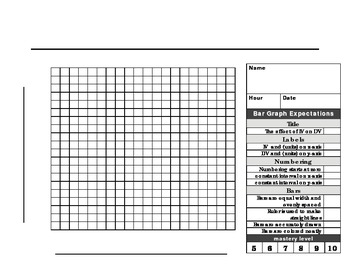
Bar Graph paper and rubric
This 20 X 20 graph paper with rubric is made for a beginner scientist to make a the perfect BAR graph. The checklist format makes it easy for students to know what is expected when graphing. Enjoy!
Subjects:
Grades:
1st - 12th, Higher Education, Adult Education
Types:
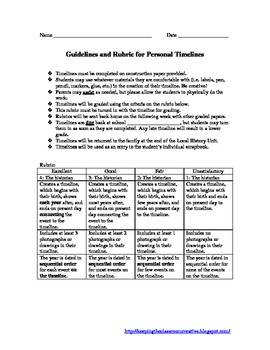
Student Timeline
This is a guide for student creation of a personal timeline. It is connected to Ohio standards in History under Historical Thinking. Timelines are to be completed on construction paper provided by the teacher.
Students may use whatever materials they are comfortable with (i.e. labels, pen, pencil, markers, glue, etc.) in the creation of their timeline. Let them be creative!
Parents may assist as needed, but please allow the students to physically do the work.
Timelines are then graded using the
Grades:
2nd - 6th
Types:
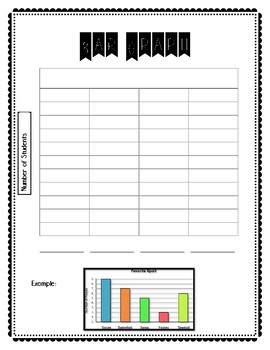
Graphing Performance Task (GOMath Unit 10)
This FUN real world based project starts by asking students to create their own survey question to help the principal learn more about his/her students. After students survey their classmates, they display the data in the form of a tally chart, pictograph, bar graph, and line graph. Students can then take it one step further and create a poster with the information they gathered.I also made this project cross curricular because after making the poster students wrote letters to the principal expl
Halloween Writing and Graphing
This is a great bundle to get for Halloween. They are great pieces to display on bulletin boards or in the hallway especially for Halloween Parties. Everything you need for writing an opinion piece is included (graphic organizers, rubric, I can poster, creative writing poster). There is also a math component. Students can sort and graph Halloween costumes. Thank you for looking and I hope you enjoy using this in your classroom as much as I did.
Subjects:
Grades:
1st - 3rd
Types:
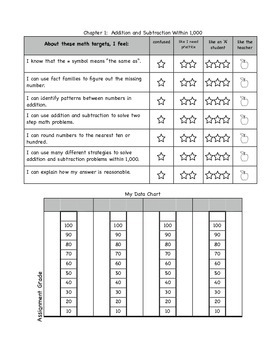
Common Core I Can Data Charts for 3rd Grade Math
This is a series of data charts created to accompany the Go Math Series. Each page is a combination of the Common Core 'I Can Statements' and a corresponding graph for students to both rate their level of understanding and graph their test or assignment scores. The 'I Can Statements' are specific to what is being covered in the Go Math series. The graphs change so that students practice using different types of graphs. I use these data charts as a tool to increase student ownership of their
Grades:
3rd
Types:
CCSS:
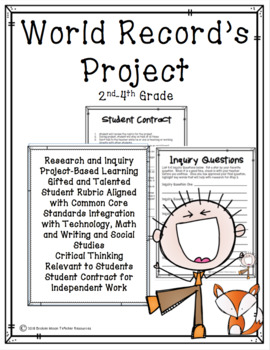
World Record's Project
Students will incorporate reading, analyzing and creating charts and graphs, researching on the internet, writing and social studies. After developing Inquiry questions about world records, students will research one of their questions. After comparing different records and websites by taking notes, students will write their own article with a graphic source from the information they researched. This project is great for higher level students who need a deeper connection to content that is re
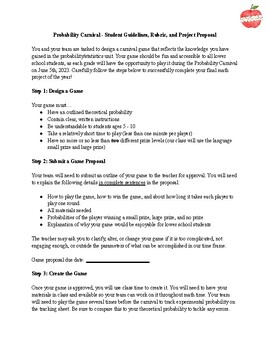
Probability Carnival Freebie
Students will dive into the core skills of probability by designing, creating, proposing, and reflecting upon a carnival game (a bloom's taxonomy dream)! Use and adapt this resource to fit the needs of your classroom to create a memorable learning experience. *Highlights: probability, statistics, graphing, project based learning, game design, teamwork, student-centered learningOptional inquiry-based learning essential question: How can we, as mathematicians, design and create an age appropriate
Subjects:
Grades:
3rd - 8th
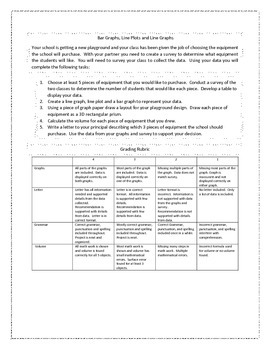
Bar graphs, line graphs, line plots and volume
Students will create a survey where they will choose 5 pieces of new playground equipment. They will need to conduct their survey and then create a line graph, line plot and a bar graph to display their data. They will also need to create a layout on graph paper to show where they would place each piece of equipment. Draw the pieces as 3D rectangular prisms and find the volume for each figure. They will then need to write a letter to their principal explaining which equipment they should buy
Subjects:
Grades:
3rd - 4th
Types:
CCSS:
3 Graphing Centers for Upper Primary
3 math graphing centers for upper primary including bar graphs, picture graphs, and data charts. Full preview given. Centers are hands-on and use pop-cubes, graph paper, and more.
Rubrics included for each center!
3 Graphing Centers for Upper Primary by Mrs. Skipworth's Secrets is licensed under a Creative Commons Attribution-NoDerivatives 4.0 International License.
Grades:
2nd - 3rd
Types:
Favorite Ice Cream Flavors
This is a graphing activity for 3rd grade. It contains the complete lesson, sample of work, and a rubric.
Subjects:
Grades:
3rd
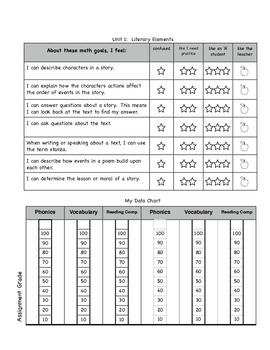
Common Core I Can Data Charts for 3rd Grade Reading
This is a data chart created to accompany the Reading Street Series. It combines the Common Core 'I Can Statements' and a coresponding graph for students to both rate their level of understanding and graph their test or assignment scores. The 'I Can Statements' are specific to what is being covered in the Reading Street series. The graphs change so that students practice using different types of graphs. I use these data charts as a tool to increase student ownership of their learning.
Grades:
3rd
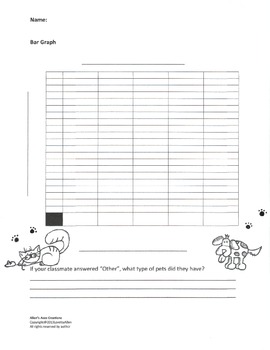
Graphing Classmate's Pets
This activity is hands on fun math!!! The students get to mingle with their classmates as they collect data on who has pets and what kind. Students love learning about each other.
After the students have surveyed their classmates, they use the data to create a bar graph of their classmate's pets. What better way to learn about bar graphs, than creating your own!!
Great "Ice Breaker" activity for the first week of school!
I have kept the pintables simple, so they do not use up all your print
Grades:
2nd - 6th
Types:
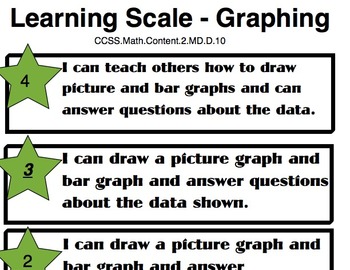
Learning Scale for Graphing
0-4 Learning Scale for graphing with 3 being the targeted proficiency level according to Common Core standards.
Subjects:
Grades:
1st - 3rd
Types:
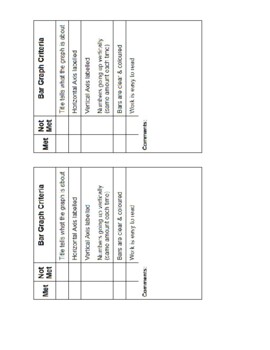
Rubric Labels for Bar Graphs
Use standard mailing labels to print these mini-rubrics, used with Survey Project!
Showing 1-24 of 25 results


