87 results
3rd grade graphing unit plan pdfs
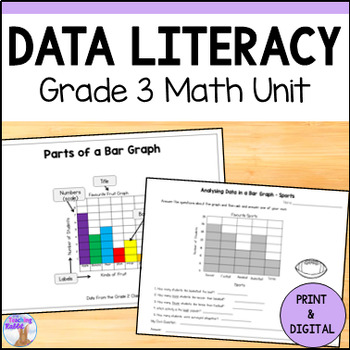
Data Literacy Unit - Sorting & Graphing - Grade 3 Math Ontario - Data Management
This Data Management Unit for Grade 3 covers sorting data by 2 & 3 attributes, collecting data, creating & analyzing graphs, and finding the mode and the mean of data sets. It includes lesson ideas, worksheets, a math center, and a test. It is based on the 2020 Ontario Math Curriculum and covers expectations D1.1., D1.2, D1.3, D1.4 & D1.5. This resource includes both print & digital versions. A link in the PDF will take you to the digital resource.This unit is also part of my Gra
Grades:
3rd
Types:
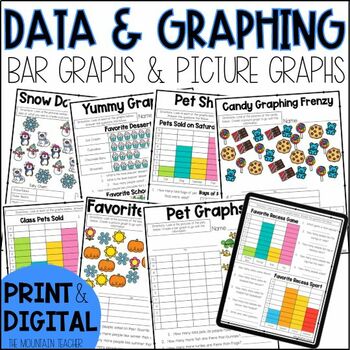
Bar Graphs and Picture Graphs Graphing Worksheets for 2nd Grade
Teach bar graphs and picture graphs to your 2nd or 3rd graders with ease using these graphing worksheets and assessments. This 3 week unit is filled with printable and digital graphing worksheets, assessments and activities covering various types of word problems about different graphs.Students will practice collecting data, graphing data on bar graphs and picture graphs and answering questions about the data using the graphs. Students will practice using graph keys on both picture graphs and ba
Subjects:
Grades:
1st - 3rd
Types:
CCSS:
Also included in: 2nd Grade Math Worksheets and Lessons YEAR BUNDLE Print and Digital
Math Unit Year Long Bundle | Grade 3 | Interactive Math Units for Canada
What if you could have your entire year of math lesson plans written for you? Our interactive notebook comes with everything you need to plan, teach, practice, and assess math. We give you everything you need to explicitly teach concepts for place value, number operations, patterns, graphing, measurement, time, geometry and more in your Canadian Grade 3 classroom.This engaging resource includes:6 complete units.a bonus year plan to help sequence your year.instructions for how to set up, assess,
Subjects:
Grades:
2nd - 4th
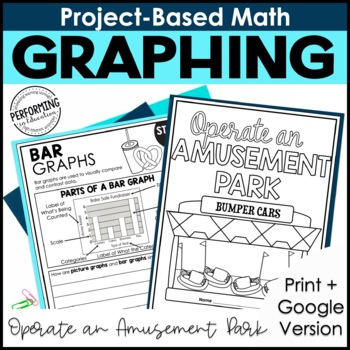
Math Project-Based Learning: Draw Picture Graphs & Bar Graphs | Data | 3rd Grade
This 5-day project-based math resource applies math concepts in a real-world scenario to teach students about drawing scaled picture graphs and scaled bar graphs. In this 5-day unit, students will apply graphing concepts to create scaled picture and bar graphs and answer questions about the data in the graphs. This graphing math project is engaging and authentic. Plus, it's available as both a digital and print resource.This project-based math resource covers concepts of rounding and is aligned
Subjects:
Grades:
3rd
Types:
CCSS:
Also included in: The Project-Based Math Library | 3rd Grade Math Project-Based Learning
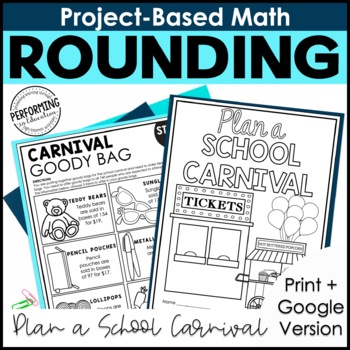
Math Project-Based Learning: Rounding to the Nearest 10 or 100 | Place Value 3rd
This 5-day project-based math resource applies math concepts in a real-world scenario to teach students about rounding to the nearest 10 and rounding to the nearest 100. In this 5-day unit, students will apply place value concepts to plan a school carnival. This rounding project is engaging and authentic. Plus, it's available as both a digital and print resource.This project-based math resource covers concepts of rounding and is aligned with the following 3rd Grade Math Common Core State Standar
Subjects:
Grades:
3rd
Types:
CCSS:
Also included in: The Project-Based Math Library | 3rd Grade Math Project-Based Learning
3rd Grade Lesson Plans Data Analysis TEKS 3.8A
Complete Lesson Plans for Data Analysis. This unit teaches TEKS 3.8A- Summarizing data using a frequency table, dot plot, pictograph and bar graph. Scaled intervals lessons and interventions are included!I have broken down each TEK into Learning Targets to make it easier to track student progress. There are 4 skills in this unit! A student data sheet is included for students to reflect on their own learning for the unit. A teacher tracking sheet is included to make small group instruction easi
Grades:
3rd
Types:
CCSS:
Also included in: 3rd Grade Math Yearlong Bundle Follows TEKs
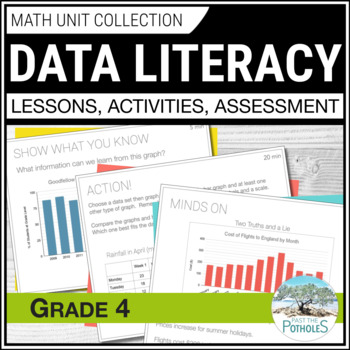
Grade 4 Ontario Data Management Unit Collecting Data Reading Graphs Infographic
Save time and stress! This COMPLETE Data Literacy unit includes EVERYTHING YOU NEED to guide students with collecting data, analyzing data, reading graphs, finding averages. It includes 3-part math Google Slides lessons, projectable slides for following along, taking notes, and creating anchor charts. It also includes practice worksheets, review activities, math centres, assessments, and Ontario math report card comments. Lesson topics: ❉ Describe and Compare Qualitative & Quantitative D
Subjects:
Grades:
3rd - 5th
Types:
CCSS:
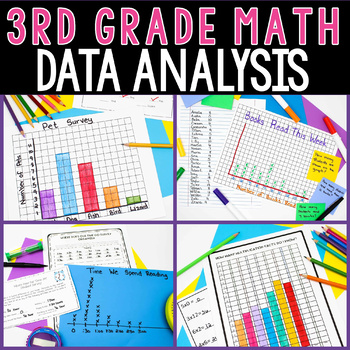
Graphing Unit | 3rd Grade | Print & Digital
This 3rd grade graphing unit teaches graphing-with a twist! There are 20 graphing activities in this unit. graphing The lessons can be taught as an individual graphing unit, or you can integrate the graphing lessons into your other math units! This graphing unit contains at least two graphing activities for each of the math concepts:-Place Value-Addition/Subtraction-Multiplication/Division-Fractions-Time-Measurement-GeometryYou'll find detailed graphing lesson plans and a combination of picture
Grades:
3rd
Types:
Also included in: 3rd Grade Math Bundle | Math Workshop & Guided Math | Print & Digital
Measurement and Line Plots Math Unit - 3rd grade
Measurement and Line Plots: Measurement to the Quarter Inch & Understanding Line Plots and Measurement Math UnitThese lesson plans cover the following concepts: -measuring length to the nearest whole inch-measuring length to the nearest half inch-why we include whole inches when measuring to the nearest half inch-measuring length to the nearest quarter inch-why we include half and whole inches when measuring to the nearest quarter inch-measurement reteaching lesson/ activity/ worksheets-meas
Subjects:
Grades:
3rd
Types:
CCSS:
Also included in: Third Grade Common Core Measurement Bundle
Weather Unit: Super File Folder!
This is a terrific 57-page resource for your weather unit! It is designed to be used with a file folder for each student where they make and create multiple foldables to put inside their file. It becomes a SUPER file on weather once you are all done. At the end of the unit they have all of their learning in one place. You can decide to use it as a study guide later for your own assessment as well. The design is that you can pick what is best for your students and grade level. Some items ma
Subjects:
Grades:
1st - 4th
Types:
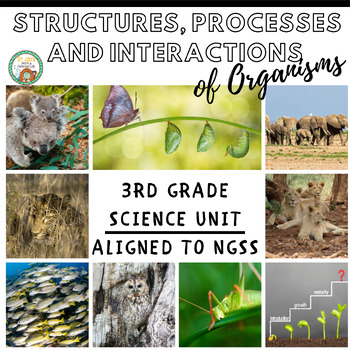
3rd Grade Science: Structures, Processes, and Interactions of Organisms
This unit engages students in inquiry-based activities to help them gain a conceptual understanding of life cycles, animals benefits from living in groups, adaptations and natural selection. Many opportunities for data collection and analysis are embedded in the mini unit allowing teachers to integrate math standards. This Unit was designed to address these NGSS Science Standards for 3rd grade:3-LS1-1. Develop models to describe that organisms have unique and diverse life cycles, but all have
Subjects:
Grades:
3rd - 5th
Types:
NGSS:
3-LS2-1
, 3-LS4-3
, 3-LS4-2
, 3-LS1-1
Also included in: Custom Bundle for Jessica (Tennessee 5th Grade Science)
Mean, Median, Mode, and Range Packet
***New, Updated Product 5/5/2015*** Now Includes Answer Key Mean, Median, Mode & Range!These 4 math concepts can be challenging to learn. With this basic practice packet, students will learn and practice finding out this information. Packet includes a vocabulary sheet that shows students how to find the answer for each and gives an example problem!Teach along with the packet, use it for extra practice, in centers, etc. There are lots of possibilities!
Roller Coaster Unit (Forces and Motion)
This 20 page unit includes the following:
Color and black/white posters/slides for the definitions of:
Forces
Motion
Gravity
Momentum
Acceleration
Speed
Have You Ever Ridden a Roller Coaster? Data Sheet
Roller Coaster Schema
Wild Roller Coaster Ride Writing Planning Page
Wild Roller Coaster Ride Senses Writing Page
Wild Roller Coaster Ride Writing Page
Design Your Own Roller Coaster Planning Page
Roller Coaster Blueprints
End this fun unit with the construction of roller coasters using pool n
Grades:
1st - 3rd
Types:
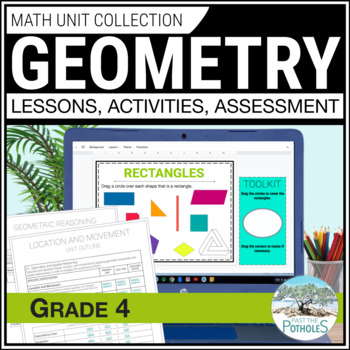
Grade 4 Ontario Math Unit | Location & Movement Geometric Transformations Shapes
Ontario Grade 4 Math Teachers! This COMPLETE Geometry unit covers Location & Movement, Rigid Geometry Transformations and Geometric Shapes. It includes Google Slides lessons, practice worksheets, review activities, centres, games, assessments, and Ontario math report card comments...! Aligned to 2020 Ontario Curriculum.LOCK IN THIS PRICE! **You will have FREE LIFETIME UPDATES for any future updates and additions.**------------------------------ ABOUT THE GRADE 4 ONTARIO MATH RESOURCE ----
Grades:
3rd - 5th
Types:
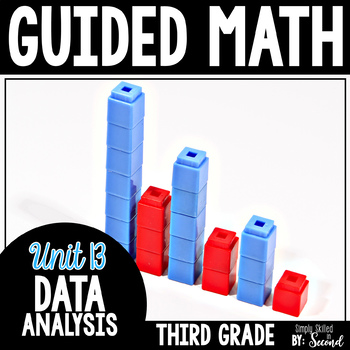
Guided Math DATA ANALYSIS - Grade 3
Guided Math activities - Guided Math DATA ANALYSIS - Grade 3
This DATA ANALYSIS Guided Math Resource includes EVERYTHING you will need to teach DATA ANALYSIS concepts in your 3rd grade classroom. It is aligned to the Common Core State Standards.
WAIT! If you like this resource, check out my GUIDED MATH MEGA YEARLONG BUNDLE!
- Click HERE to check it out!
This Guided Math DATA ANALYSIS Resource includes:
☞ Fully Detailed Standards-based DATA ANALYSIS Lesson Plans for Small Group Instructio
Subjects:
Grades:
3rd
Also included in: Third Grade Guided Math Curriculum Bundle
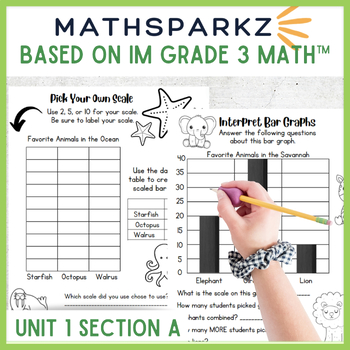
Math Sparkz - based on Illustrative Math (IM) 3rd Grade Unit 1, Section A
This 21 page packet is directly aligned with the third grade IM math unit all about interpreting and representing and data on scaled graphs.This packet provides excellent independent or whole group practice to:Interpret scaled picture graphsInterpret bar graphs Represent data using scaled picture and bar graphsSolve one-step and two-step story problems using addition and subtractionThis is packet provides great extra practice for the first few graphing questions on the IM test Unit 1 test - 3rd
Subjects:
Grades:
2nd - 4th
Also included in: Math Sparkz Bundle - based on Illustrative Math (IM) 3rd Grade, Unit 1
Hot Chocolate: FUN Winter Reading, Writing, Math, and Science Unit
Hot chocolate is the perfect vehicle to engage your students in an interdisciplinary unit featuring reading comprehension, writing, math, and science activities they are sure to love. In this unit you will find four complete lesson plans and accompanying printable sheets to help you teach several common core standards. The lesson plans will guide you through teaching your students the following topics, all within a hot chocolate theme:In this unit, students will be:responding to a reading comp
Grades:
3rd - 4th
Types:
Pets Theme Unit
Pet UnitCurriculum Connections: Science: Animal Habitats, Animal Growth & Health, Wild vs. Domestic Social Studies: Needs & WantsEnglish Language Arts: Procedural Writing, Persuasive WritingMath: GraphingThis Pet Product includes:Procedural Writing InstructionsPet Care FactsCare Fact Templates are for: dogs, cats, hamsters, rabbits, guinea pigs, fish, birds, snakes, turtlesProcedural Writing OrganizersPersuasive Writing InstructionsI Want a Pet Please – Writing TemplateLetter Writing Tem
Grades:
1st - 3rd
Types:
Grade 2 Lesson 7 Math
This Module focuses on graphing, money, and measurement. This packet includes 1 page of supplemental work for all 26 lessons of Module 7 grade 2.
This is great for homework, small group instruction, students with special needs, early finishers, assessment, or whole group instruction.
If you like this product, check out the rest of grade 2 supplemental packets.
NEW** Eureka Math/Engage NY Grade 2 BUNDLE!
Subjects:
Grades:
1st - 3rd
Types:
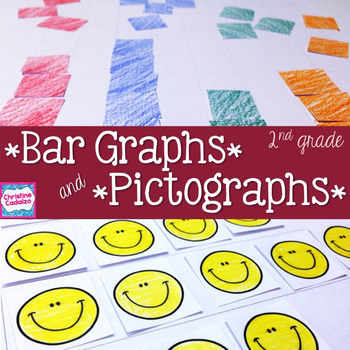
Pictograph and Bar Graph Math Unit- Second Grade
Complete math unit for teaching Common Core standard 2.MD.10- making and reading pictographs and bar graphs. This unit covers the following pictograph & bar graph concepts:Reading Bar Graphs: -what a bar graph is and why we use them-reading the title and labels of a bar graph-understanding a bar graph scale-finding how many in each category-strategies for answering addition and subtraction questions based on the bar graph dataMaking Bar Graphs:-making a four category bar graph-making a singl
Subjects:
Grades:
1st - 3rd
CCSS:

Data & Graphing Interactive Notebook: A Complete Unit
Are you looking for an engaging way to teach data and graphing? This interactive notebook product is designed to be a reference tool as well as practice/application for key measurement concepts. This unit contains 6 lessons. Each lesson comes with an information page (Learning Side) and several activities to practice the lesson objective (Thinking Side). If you don't use this format, you can use the information pages as teaching tools and use the practice activities in the student notebooks.
TH
Grades:
2nd - 3rd
Bar Graphs and Picture Graphs Common Core MCC3.MD.3
This is an 80+ page graphing unit that goes over bar graphs and picture graphs. This unit correlates 100% with Common Core standard MCC3.MD.3: Draw a scaled picture graph and a scaled bar graph to represent a data set with several categories. Solve one-and two-step “how many more” and “how many less” problems using information presented in scaled bar and picture graphs.
This unit includes 5 days worth of whole group and small group lesson plans. Activities are as follows:
Day 1: Bar Graphs
Grades:
2nd - 4th
Types:
CCSS:
Graphs Galore
Ready for a week full of graphing? This unit follows the "I do" "We do" "You do" teaching style where students learn about pictographs, bar graphs, pie graphs, line graphs, and line plots, practice with them, then apply it themselves. *The application piece was my students' favorite part! For each type graph, students will 1.) create a class graph together learning the parts and how to pull information from it. 2.) View a pre-made graph and interpret data from it. 3.) Create their own graph
Subjects:
Grades:
2nd - 5th
Types:
Energy and Forces Unit- Roller Coasters
Use this unit to teach second grade GPS S2P2.
End this unit with building roller coasters out of pool noodles and marbles!
This 42 page unit includes the following:
Color and black/white slide/poster for the following definitions:
Energy
Light
Heat
Friction
Sound
Motion
Forces
Gravity
Momentum
Acceleration
Speed
Energy Sources Circle Map
Energy Sources (Natural/Manmade) Tree Map
Energy Sources (Renewable/Nonrenewable) Tree Map
Light, Heat, Sound Energy Sources Chart
Push and Pull Sort
Fricti
Grades:
K - 3rd
Types:
Showing 1-24 of 87 results


