97 results
3rd grade statistics lesson pdfs
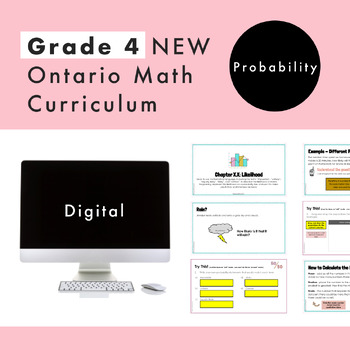
Grade 4 Ontario Math - Probability - Digital Google Slides + Form
Are you planning for the NEW Grade 4 Ontario Math Curriculum? This editable Google Slide and Google Form resource is what you need! This resource is for the DATA strand and and covers specific expectations for “D2. Probability”. In this resource, students will experience math through engaging real-life questions, storytelling through math, and interactive slides. What’s Included2 Google Slide presentations45 UNIQUE and EDITABLE Google Slides in totalSlides are editable for you to increase stud
Subjects:
Grades:
3rd - 5th
Types:
Also included in: Grade 4 NEW Ontario Math Curriculum Full Year Digital Slides Bundle
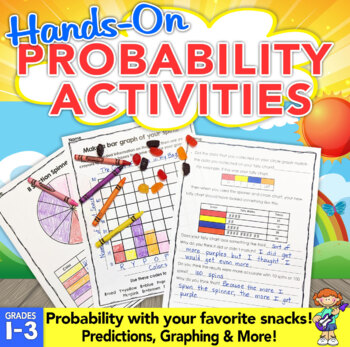
Probability Activities: Hands-On Probability with Snacks!
Probability activities are fun and engaging when you add treats! These fun probability activities allow students to experiment with probability using snacks.Students will use probability to predict, investigate, record data, and learn to use words to describe the chances of something happening.Students will love these probability activities because they are using skills with snacks! Each of the probability activities builds on each other and guides them step-by-step. Easy prep to print off the p
Subjects:
Grades:
1st - 3rd
Types:
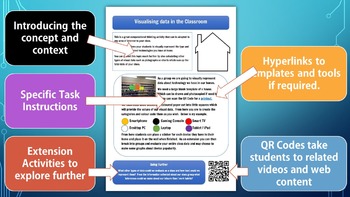
Computational Thinking & Data Analysis Task Cards | STEM | Digital Technologies
Most kids don’t naturally think like PROGRAMMERS, but you can enjoy the satisfaction of seeing them have a COMPUTATIONAL THINKING ⚡“A-ha!”⚡ moment as they learn with these visual, hands-on, NO PREP STEM activities.For those students who learn best by seeing, doing, and getting their hands dirty, this activity and card set will make abstract computing concepts as real as the classroom they’re sitting in. This pack uses students’ everyday interests, such as sports and friends, to teach them how al
Grades:
3rd - 8th
Types:
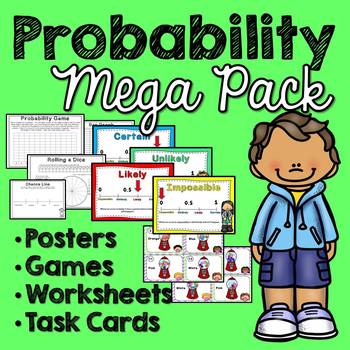
Probability (What are the Chances?) No Prep
Probability – What are the Chances? MEGA PackThis pack contains everything you need to help your students understand Probability and Chance with hands-on activities. This pack contains the following posters, games, worksheets, task cards and activities: 4 Posters – Certain, Impossible, Likely and Unlikely.Rolling a Dice ActivityBar Graph – Data Dice InvestigationProbability Game with DiceSpinner ActivitiesChoose the SpinnerCandy Math – FractionsCandy Math - Pie GraphCandy Math – Bar GraphCan
Subjects:
Grades:
1st - 4th
Types:
Also included in: Distance Learning Bundle (Grades 3-5) No Prep
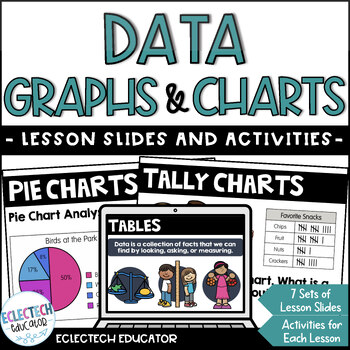
Data Management Collection, Charts and Graphs Digital Slides & Activities
Looking for fun ways to have students understand data? This math resource has everything you need to help students collect, describe, and represent statistical information using a variety of graphs and charts, such as bar graphs and pie charts. The SEVEN lessons, each with lesson slides, information, interactive activities, and practice questions, provide many opportunities to collect and represent data. TOPICS:⭐ Tables⭐ Tally Charts⭐ Bar Graphs⭐ Pictographs⭐ Pie Charts⭐ Line Plots⭐ Line GraphsE
Subjects:
Grades:
3rd - 4th
Types:
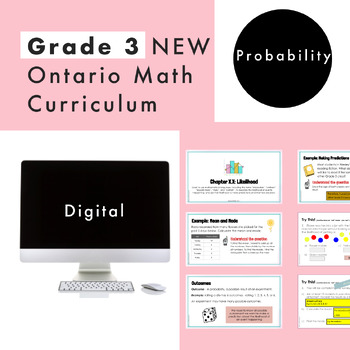
Grade 3 Ontario Math - Probability - Digital Google Slides + Form
Are you planning for the NEW Grade 3 Ontario Math Curriculum? This editable Google Slide resource is what you need! This resource is for the DATA strand and covers ALL specific expectations for “D2. Probability". In this resource, students will experience math through engaging real-life questions, storytelling through math, and interactive slides. What’s Included2 Google Slide presentations48 UNIQUE and EDITABLE Google Slides in totalSlides are editable for you to increase student engagement (
Subjects:
Grades:
2nd - 4th
Types:
Also included in: Grade 3 NEW Ontario Math Curriculum Full Year Digital Slides Bundle
Elementary Jelly Bean Probability Game
Enjoy this awesome probability game using jelly beans for an introduction to making predictions based on probability. Extremely engaging for students practicing these skills!This would be best used for Grades 3-6!Please rate me and leave feedback.
Subjects:
Grades:
3rd - 6th
Análisis de datos y Probabilidad: Pictogramas y Tablas de frecuencias Gr. 3-5
Obtén una mayor comprensión sobe los pictogramas y las tablas de frecuencia con este atractivo recurso. Los conceptos incluyen: pictogramas, suma, tablas de frecuencia, resta. Este recurso, redactado para los estudiantes de tercer a quinto grado, se divide en tres secciones: Hojas de tarea con problemas de texto, seguido por Hojas de simulacro para practicar la competencia de los estudiantes en las habilidades procesales, y finalmente una prueba de evaluación. La clave de respuestas está incluid
Subjects:
Grades:
3rd - 5th
Types:
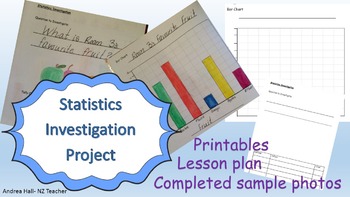
Statistics Investigation Project
This is more than a Graphing lesson plan or worksheet. By the end of the 3 lessons the students proudly present their statistics project booklet with data collected, presented and analysed.
Tried and true, I have used this lesson and project booklet in my class many times and it scaffolds the process for young students ages 7-8 years old to complete a bar chart, which can be difficult.
The project booklet becomes evidence of learning with a self evaluation section and looks good on display.
Subjects:
Grades:
2nd - 4th
Types:
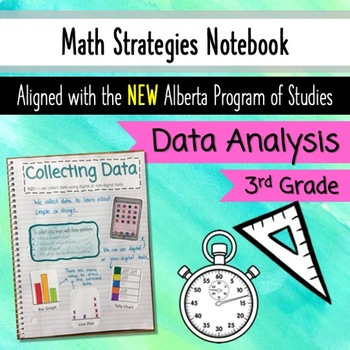
Math Data Analysis Unit - Grade 3 Alberta - Interactive Math Notebook
Interactive Math Notebook - Data Analysis Unit - Aligned with NEW Alberta Program of Studies for grade 3.This interactive Data Analysis Notebook will serve as a practical, engaging resource that students will use and reference throughout the entire year. It covers ALL 7 of your Data Analysis outcomes in grade 3.In this resource you will find:A cover page for your Interactive Math notebook,A 'Data Analysis' title page for this section of your Math notebook,An ”I Can statement” for each outcome (a
Subjects:
Grades:
3rd
Skittles Graph It!
This interactive graphing activity is not your average Skittles graphing activity! It includes activities for grades Kinder-3rd with CCSS stand alignment in type of graphs students need to be able to complete with MASTERY! This activity includes colorful images that will invite students to enjoy graphing, while enjoying a yummy treat!
I also have the Skittles and M&Ms bundle package at a discounted price. ENJOY!
Subjects:
Grades:
K - 3rd
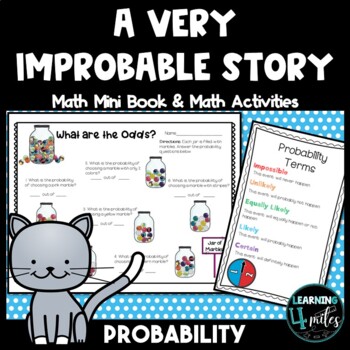
Probability Activities - Scoot Game - A Very Improbable Story Book Companion
Grab the book "A Very Improbable Story " by Edward Einhorn and learn about probability! In the book you will learn how to count the odds in probability and understand the basic vocabulary used. Students will be engaged with questions throughout the book and have extension activities. There are lesson ideas to help differentiate for your class and multiple games to play. Comes in color and black/white copies. No PREP needed. Just print & go!This product includes» Teacher Lesson Ideas» A Mini
Subjects:
Grades:
2nd - 5th
Types:
Statistics and Probability: Chance 2 – Year 4
This is a 15-page ebook from the Australian Curriculum Mathematics – Statistics and Probability series that covers:
Chance:
Identify everyday events where one cannot happen if the other happens (ACMSP093)
How many people share your birthday? What chance is there that you will visit the moon this year? Written by Clare Way, this collection of fun and relatable questions, activities and scenarios will immerse students in the world of statistics and probability, giving them an appetite for mo
Subjects:
Grades:
3rd - 5th
Types:
Statistics and Probability: Data representation and interpretation 2 – Year 3
This is a 16-page ebook from the Australian Curriculum Mathematics – Statistics and Probability series that covers:
Data representation and interpretation:
Collect data, organise into categories and create displays using lists, tables, picture graphs and simple column graphs, with and without the use of digital technologies (ACMSP069)
How many people share your birthday? What chance is there that you will visit the moon this year? Written by Clare Way, this collection of fun and relatable
Subjects:
Grades:
2nd - 4th
Types:
Skittles/M&M Graph It!
This interactive graphing activity is not your average Skittles or M&Ms graphing activity! It includes activities for grades Kinder-3rd with CCSS stand alignment in type of graphs students need to be able to complete with MASTERY! This activity includes colorful images that will invite students to enjoy graphing, while enjoying a yummy treat!
This specific product includes BOTH Skittles and M&M graphing activities. While this package is at a discounted price when buying both, you may pu
Subjects:
Grades:
K - 3rd
Probability and Statistics: Chance 3 – Year 4
This is an 18-page ebook from the Australian Curriculum Mathematics – Statistics and Probability series that covers:
Chance:
Identify events where the chance of one will not be affected by the occurrence of the other (ACMSP094)
How many people share your birthday? What chance is there that you will visit the moon this year? Written by Clare Way, this collection of fun and relatable questions, activities and scenarios will immerse students in the world of statistics and probability, giving
Subjects:
Grades:
3rd - 5th
Types:
Statistics & Probability: Chance – Year 2
This is an 18-page ebook from the Australian Curriculum Mathematics – Statistics and Probability series that covers:Chance: Identify practical activities and everyday events that involve chance. Describe outcomes as ‘likely’ or ‘unlikely’ and identify some events as ‘certain’ or ‘impossible’ (ACMSP047)How many people share your birthday? What chance is there that you will visit the moon this year? Written by Clare Way, this collection of fun and relatable questions, activities and scenarios w
Subjects:
Grades:
1st - 3rd
Types:
Mean, Median, Mode, and Range Lesson Plans, Task Cards, and Activities
This product contains 5 days worth of activities and worksheets, pre-test, and post test, answer keys, task cards, and a clever activity to help students distinguish between these different types of averages that I guarantee you have never seen before.
This item has beed revised as of 2/21/2014. I have added "I have...Who has?" that includes 20 cards that is intended to review mean, median, mode, and range plus other terms. Enjoy!
Subjects:
Grades:
3rd - 6th
Types:
Hands-On Science, C3, week 20 (ages 8-11) Classical Conversations
In this lesson, you will find:A grab-and-go script for "Candy Probability" Lesson for Hands-On Science, week 20.Naming portion includes a discussion of sampling and the importance of sample sizes.NOTE: This lesson does not require poker chips. The original activity is split into two more basic activities to break down the steps in using sampling. It also introduces the importance/impact of a smaller sample size versus a large sample size. Several printables to explain the experiment.Follow me on
Subjects:
Grades:
3rd - 6th
Types:
Análisis de datos y Probabilidad: Diagramas de barras y de círculo Gr. 3-5
Obtén una mayor comprensión sobre los gráficos de barras y los gráficos de círculo con este atractivo recurso. Los conceptos incluyen: gráficos de barras, probabilidad, gráficos de círculo, fracciones, porcentajes, redondear. Este recurso, redactado para los estudiantes de tercer a quinto grado, se divide en tres secciones: Hojas de tarea con problemas de texto, seguido por Hojas de simulacro para practicar la competencia de los estudiantes en las habilidades procesales, y finalmente una prueba
Subjects:
Grades:
3rd - 5th
Types:
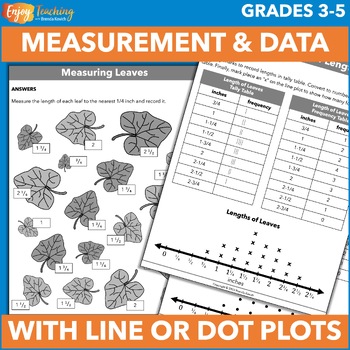
Measurement and Data Math Activities – Frequency Tables, Dot or Line Plots
These measurement and data activities pack a lot of punch! Kids measure to the nearest quarter inch, record data on tally tables, transfer it to frequency tables, and organize it on dot or line plots. Open the preview to take a closer look.First, kids learn how to handle frequency. An anchor chart explains tally tables, frequency tables, and dot or line plots with an example.Next, they measure pictures and display frequency.Students use a ruler to measure each picture to the nearest quarter of a
Subjects:
Grades:
3rd - 5th
Types:
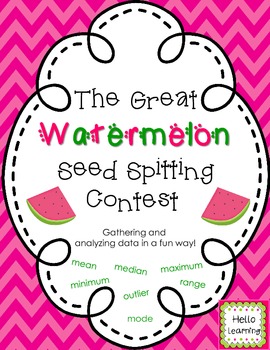
Data Landmarks- Watermelon Seed Spitting Contest
Teach your students about data landmarks in a fun way by having a watermelon seed spitting competition. Students will learn about mean/average, mode, minimum, maximum, range and outliers while having fun!
Gather the students, round up some volunteers, and pick a nice day to head outside.
Students will keep track of the distance for each of their seed spits. After the outdoor activities you will head back in to compile the data, organized the data so it is easier to interpret, find data landma
Subjects:
Grades:
3rd - 5th
Types:
Statistics and Probability: Chance 1 – Year 4
This is a 15-page ebook from the Australian Curriculum Mathematics – Statistics and Probability series that covers:
Chance:
Describe possible everyday events and order their chances of occurring (ACMSP092)
How many people share your birthday? What chance is there that you will visit the moon this year? Written by Clare Way, this collection of fun and relatable questions, activities and scenarios will immerse students in the world of statistics and probability, giving them an appetite for m
Subjects:
Grades:
3rd - 5th
Types:
Data Analysis & Probability - Task & Drill Sheets Gr. 3-5 - Distance Learning
Create graphs using gathered information and accurately read the data to make predictions. Our resource introduces the mathematical concepts taken from real-life experiences, and provides warm-up and timed practice questions to strengthen procedural proficiency skills. The task and drill sheets provide a leveled approach to learning, starting with grade 3 and increasing in difficulty to grade 5.About this Resource:Create circle graphs to match the fractions. Survey your class to find out what p
Subjects:
Grades:
3rd - 5th
Types:
Showing 1-24 of 97 results


