157 results
Statistics printables for Google Apps
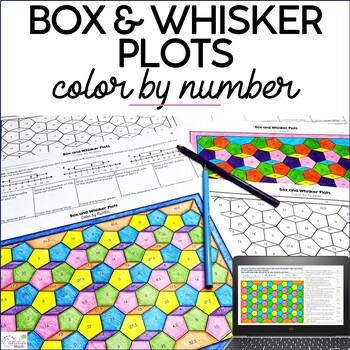
Box and Whisker Plots Color by Number Activity 6th Grade Math Coloring Pages
This box and whisker plots color by number activity includes two print and one digital version, offering engaging and versatile practice, while adding the mindfulness, wellness, and quietness coloring brings.Coloring in math has been shown to help reluctant students feel more comfortable with math:-)The box and whisker plot problems require students to identify:First quartile MedianThird quartile Interquartile rangeRange MinimumMaximum Number that would be in each quartile, based on a number of
Subjects:
Grades:
6th - 7th
Types:
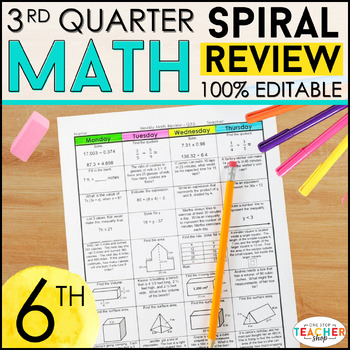
6th Grade Math Review& Quizzes | 6th Grade Math Homework | 3rd QUARTER
This 6th Grade math spiral review resource can easily be used as math HOMEWORK, WARM UPS, or a DAILY MATH REVIEW! This resource was designed to keep math concepts fresh all year and to help you easily track student progress. All pages are 100% EDITABLE and easy to differentiate to fit your students' needs. Get the ENTIRE YEAR BUNDLE! {CLICK HERE}☝☝ Check out the Preview for more details and 3 FREE Weeks! ☝☝This Spiral Review System is also available forLANGUAGE (Grammar & Word Study)READINGG
Subjects:
Grades:
6th
Types:
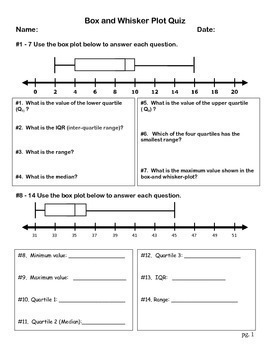
Box and Whisker Plot Quiz (Paper Format & Google Form)
PDF Copy & Google Form This 25 question quiz assess student's understanding of box and whisker plots. Questions are asked about median, IQR, range, lower extreme, upper extreme, and more. Students are also tasked with finding the median of several data sets as well as determining the five number summary of a data set. Check out the preview!
Subjects:
Grades:
6th - 8th
Types:
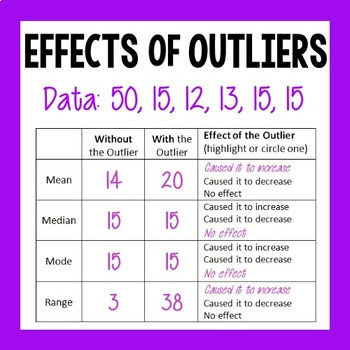
Effects of Outliers - NOW WITH DISTANCE LEARNING GOOGLE SLIDES!
How does an outlier affect the mean, median, mode, or range? Does it always have an effect? What predictions can you make about how the outlier will affect these measures?These 6 quick and easy tables will help you students make generalizations (such as a larger outlier will always increase the mean). And now this product also includes a Google Slides version, compatible with Google Classroom for Distance Learning! You will receive a 2-page student PDF version, and an answer key. And you wil
Subjects:
Grades:
5th - 6th
Types:
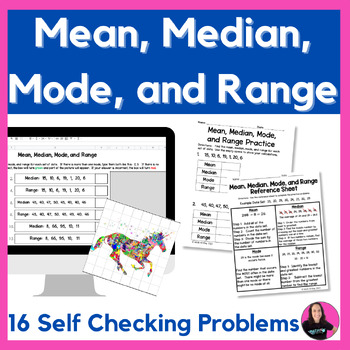
Measures of Central Tendency - Mean, Median, Mode, and Range Activity
In this 6th grade math resource, students will practice finding the mean, median, mode, and range. They will calculate the measures of central tendency with 16 problems, using four different sets of data. This activity is digital and printable. One of the printable pages is a reference sheet, which gives an example set of data and how to find the mean, median, mode, and range.For the digital activity, students will love watching the mystery picture reveal itself as more and more questions ar
Subjects:
Grades:
5th - 7th
Types:
CCSS:
Histogram Hike - Google Slides and PDF Versions
Want to make histograms fun and keep your student active?Just cut out these 14 histograms/data tables, and post them around the perimeter of your classroom. Place one or two students at each station. Your students will read the question, interpret the data display, and record their answers next to the corresponding number on their papers. And now, your purchase also includes a Google Slides version for Distance Learning! You will need a Google account to access this version.There is also a k
Subjects:
Grades:
5th - 7th
Types:
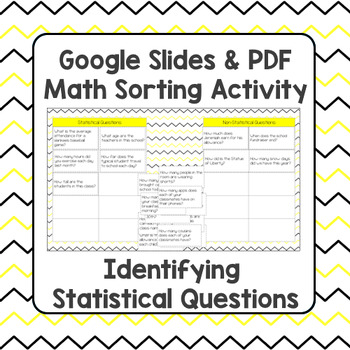
Statistical Question Sort - Digital Google Slides and PDF Versions
Students need to find measures of center and variability, and display data in a variety of ways.This all starts with identifying and asking statistical questions! You will receive 2 versions of this activity: 1 PDF and key, and 1 link to a Google Slides version for Distance Learning! You need a Google account to access the digital version. You can In this sorting activity, students cut out 20 question cards to sort manually, or they drag and drop cards in the digital version to sort in a Goog
Subjects:
Grades:
6th
Types:
CCSS:
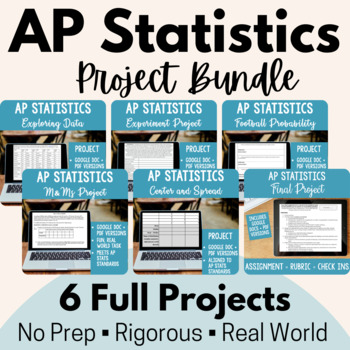
AP Statistics Project Bundle! 6 Projects + digital versions
Looking for some engaging, real-world projects to liven up your AP Statistics course? Need new materials that are ready for remote/ online learning? Want to make sure your AP Statistics course properly prepares student for the AP exam? Look no further - this bundle is for you! In this bundle, you will find four of my popular AP Statistics projects -- all updated to include EDITABLE google docs to assign to students as well as PDFs for printing, if you prefer. All projects also include a complete
Subjects:
Grades:
10th - 12th
Types:
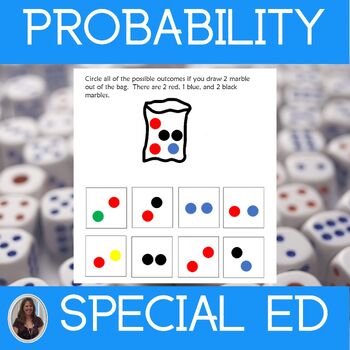
Chance & Probability Math Worksheets Special Education Statistics & Probability
This unit on Chance and Probability contains printable and digital math worksheets for special education. This statistics and probability unit is for students who take alternate assessments.This Chance and Probability unit helps students understand how to determine the probability of an event and all its possible outcomes. The worksheets, which use pictures and color coding, are differentiated. There are many ways for students to practice these skills in this unit that are at different levels.
Subjects:
Grades:
7th - 9th
Statistics Curriculum Statistics and Probability Special Ed Math Curriculum
Save $$$ with this Statistics Curriculum. This special ed math curriculum contains 8 units from my series on statistics including statistics and probability. They were developed for students with autism and special learning needs in middle and high school. Each unit is structured in the same way with similar content to enable your students to make connections and build on what they learn in each unit. This repetition of format helps ease anxiety and free up mental space when learning more di
Subjects:
Grades:
8th - 10th
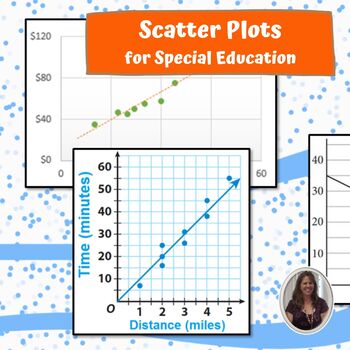
Scatter Plots for Special Education PRINT AND DIGITAL
This unit on Scatter Plots has almost 200 pages and 72 slides of material specifically designed for students with special learning needs, especially autism who are in middle and high school. This unit focuses on helping students interpret and read scatter plots. There are differentiated versions of the worksheets that use pictures and color coding. There are many, many worksheet for students to practice in this unit that are at different levels. There are MANY opportunities for students to e
Subjects:
Grades:
8th - 10th
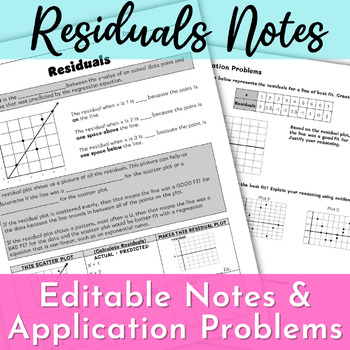
Residuals and Residual Plots for Regression Guided Notes
Students discover the connection between residual plots and assessing the fit of the linear regression with these simple notes. Students then apply their understanding to application problems that require higher order thinking.Included:PDF versionEditable Google Doc versionAnswer KeyDon't forget to leave a review so you can earn TPT credit!
Subjects:
Grades:
8th - 9th
Types:
CCSS:
Also included in: Regression Unit Bundle
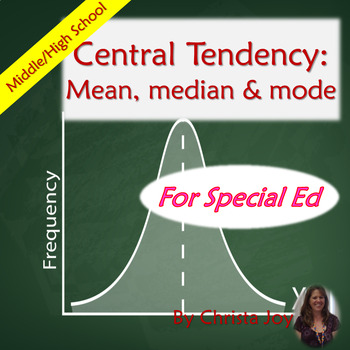
Central Tendency: Mean, Median, and Mode for Special Ed PRINT AND DIGITAL
This unit on Central Tendency has almost 200 pages of material specifically designed for students with special learning needs, especially autism who are in middle and high school. This unit mainly focuses on helping students identify the mean, median, and mode of data sets, surveys, and graphs. There are differentiated versions that use pictures and color-coding. Students will also practice identifying graphs that have a normal distribution. Finally, there are some worksheets where students
Subjects:
Grades:
8th - 10th
Types:
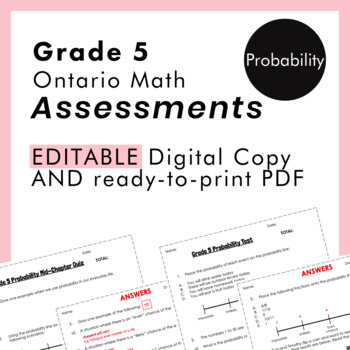
Grade 5 Ontario Math - Probability Assessments - PDF+Google Slides
This resource is for the Grade 5 DATA strand of Probability. ***This resource is meant to be used with my Grade 5 Probability Unit, but can also be used separately.*** Do you need summative assessments for the NEW Ontario Math Curriculum? This NO-PREP, PDF and editable resource is what you need! This resource contains summative assessments for your students to apply what they have learned in the Data strand for Probability. This package contains 2 assessments: a Mid-Chapter Quiz and a Unit Test.
Subjects:
Grades:
4th - 6th
Types:
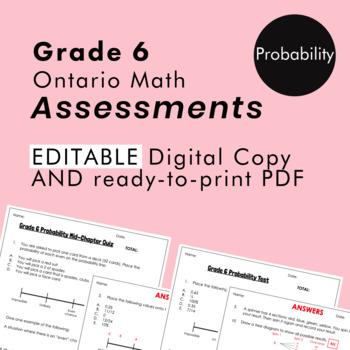
Grade 6 Ontario Math - Probability Assessments - PDF+Google Slides
This resource is for the Grade 6 DATA strand of Probability. ***This resource is meant to be used with my Grade 6 Probability Unit but can also be used separately.*** Do you need summative assessments for the NEW Ontario Math Curriculum? This NO-PREP, PDF and editable resource is what you need! This resource contains summative assessments for your students to apply what they have learned in the Data strand for Probability. This package contains 2 assessments: a Mid-Chapter Quiz and a Unit Test.
Subjects:
Grades:
5th - 7th
Types:
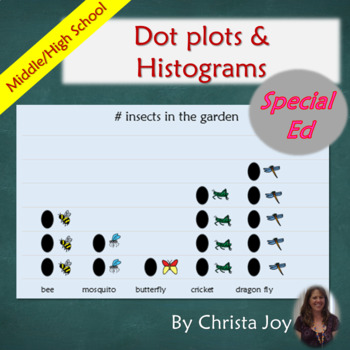
Dot plots and histograms for Special Education PRINT AND DIGITAL
This unit on dot plots and histograms has over 100 pages and 52 google slides of material specifically designed for students with special learning needs, especially autism who are in middle and high school. This unit mainly focuses on helping students understand, create, and interpret these two ways of displaying data. There are differentiated versions that use pictures and color-coding. There are also hands-on activities to give students practice creating their own dot plots with manipulativ
Subjects:
Grades:
8th - 10th
Types:
Grade 4 Ontario Math - Probability Assessments - PDF, Google Slides
This resource is for the Grade 4 DATA strand of Probability. ***This resource is meant to be used with my Grade 4 Probability digital unit but can also be used separately.*** Do you need summative assessments for the NEW Ontario Math Curriculum? This NO-PREP, PDF and editable resource is what you need! This resource contains summative assessments for your students to apply what they have learned in the Data strand. This package contains 2 assessments: a Mid-Chapter Quiz and a Unit Test. The ass
Subjects:
Grades:
3rd - 5th
Types:
Grade 7 Ontario Math - Probability Assessments - PDF+Google Slides
This resource is for the Grade 7 DATA strand of Probability. ***This resource is meant to be used with my Grade 7 Probability Unit but can also be used separately.*** Do you need summative assessments for the NEW Ontario Math Curriculum? This NO-PREP, PDF and editable resource is what you need! This resource contains summative assessments for your students to apply what they have learned in the Data strand for Probability. This package contains 2 assessments: a Mid-Chapter Quiz and a Unit Test.
Subjects:
Grades:
6th - 8th
Types:
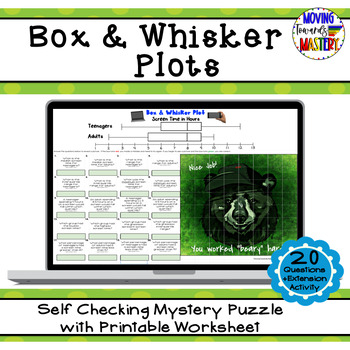
Box & Whisker Plots Self Checking Mystery Picture
Engaging math self checking review activity to practice interpreting & comparing box and whisker plots.Students will answer questions to reveal a mystery puzzle as they work, similar to a pixel art activity! If students answer incorrectly, the box will turn red to notify students they made a mistake. A printable worksheet is included if preferred.This resource includes...♦ 20 questions to interpret and/or compare box & whisker plots♦ Printable worksheet included ♦ Extension activity inc
Subjects:
Grades:
6th - 8th
Types:
6th Grade Module 6 Quizzes for Topics A to D - Editable
Howdy,Update November 2020: You asked for it and here they come: Digitally Interactive too.This product has the quizzes in four formats: editable Word Document, link to editable Google Document, standard PDF, and Digitally INTERACTIVE PDF.Are you using Engage NY math? Here are some great quizzes for you. I have written the Topic quizzes for 6th grade Module 6. There are 4 quizzes, one for each topic A to D. These are aligned to SBAC and use the Smarter Balanced Item Specs.You will get great data
Subjects:
Grades:
6th - 7th
Types:
Also included in: 6th Grade All Product Bundle (24 products) - Editable - SBAC
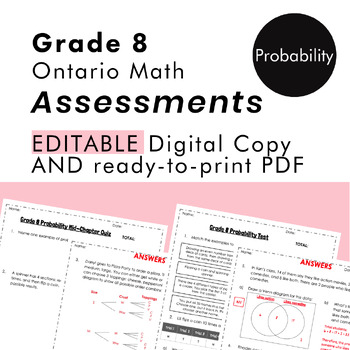
Grade 8 Ontario Math - Probability Assessments - PDF + Google Slides
This resource is for the Grade 8 DATA strand of Probability. ***This resource is meant to be used with my Grade 8 Probability digital unit but can also be used separately.*** Do you need summative assessments for the NEW Ontario Math Curriculum? This NO-PREP, PDF and editable resource is what you need! This resource contains summative assessments for your students to apply what they have learned in the Data strand. This package contains 2 assessments: a Mid-Chapter Quiz and a Unit Test. The ass
Subjects:
Grades:
7th - 9th
Types:
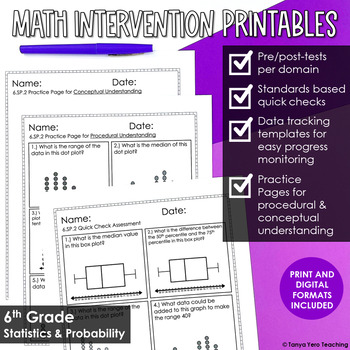
6th Grade Math Intervention Statistics & Probability | RTI Progress Monitoring
A comprehensive, no prep, standards-based pack of RTI 6th grade math intervention resources for the statistics and probability standards. This research-based intervention pack includes tools for building a systematic, data-driven intervention process.With pre/post-tests for executing screening, quick checks for progress monitoring, practice pages for guided and independent practice and data tracking forms, this math intervention resource will organize and transform your intervention instruction.
Subjects:
Grades:
6th - 7th
Types:
Probability and Measures of Central Tendency 6th 7th Grade Math Custom Bundle
Custom Bundle with the following resources:Probability Practice with Tree DiagramsCompound Probability Stoplight ActivityCompound Probability Task CardsData Display Error AnalysisMean Absolute Deviation ActivityMean, Median, Mode, and Range ActivityMean Median Mode Range Task CardsMean, Median, Mode, and Range Scavenger HuntMean, Median, and Mode ActivityMean, Median, Mode, & Range Error AnalysisBox-and-Whisker Plot Stoplight ActivityDon't forget to leave feedback on your paid items so that
Subjects:
Grades:
6th - 7th
Types:
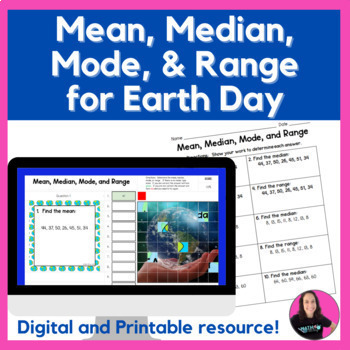
Measures of Central Tendency Earth Day Activity - Mean, Median, Mode, Range
Do your 6th grade math students need practice finding the mean, median, mode, and range? This resource will have students calculating the measures of central tendency with 10 problems, using three different sets of data. This activity is digital and printable. For the digital activity, students will love watching the mystery picture reveal itself as more and more questions are answered. Celebrate Earth Day in math class with this fun double mystery picture! This resource is no prep, self
Subjects:
Grades:
5th - 7th
Types:
CCSS:
Showing 1-24 of 157 results


