10 results
Statistics printables for Microsoft Excel
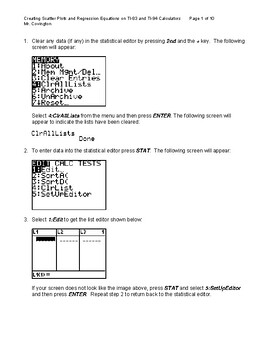
Creating Scatter Plots and Lines of best fit on TI-83/84 Graphing Calculator
A tutorial and reference guide for working with two-variable data to generate scatter plots and least squares method line of best fit on TI-83/84 graphing calculators and Microsoft Excel.
Subjects:
Grades:
8th - 12th, Higher Education, Adult Education
Types:
Spreadsheet Interactive Lesson {6.SP.4}
Looking for step by step instructions for interactive note booking using spreadsheets? This file is exactly what you need! There are complete instructions for notebook organization and how students use a self assessment stop light graphic organizer to communicate their comprehension of the lesson. This lesson includes complete instructions and student black line masters. There are also pictures of sample pages. My student's favorite part of this lesson is entering the data on computers and creat
Subjects:
Grades:
4th - 8th
Types:
CCSS:
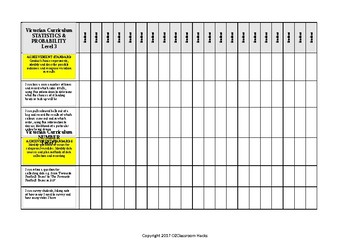
Mathematics STATISTIC PROBABILITY Checklist Level 3 Victorian Curriculum 'I Can'
Level 3 Statistics and Probability Checklist aligned with the Victorian Curriculum. Fed up with recreating new checklists - ME TOO! Hope this helps. Here is a checklist completely aligned with the Victorian Curriculum. All put simply in 'I Can' statements as YOU WOULD TEACH IT!
MAKE LIFE SIMPLE! Teaching is time consuming enough.
Subjects:
Grades:
PreK - 6th
Types:
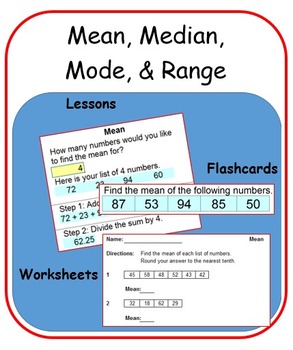
Mean, Median, Mode, & Range
Use the magic of Microsoft Excel to generate countless examples, stimulate discussion, and build student confidence and competence in calculating mean, median, mode, and range.
ALL the work has been done for you! All you have to do is:
1. Open the downloaded Excel file.
2. Click on one of the lesson tabs located at the bottom of the screen.
3. Press the appropriate key(s) to generate an example (F9 for PC; Command + Equal for Macs).
4. Demonstrate, discuss, review, and learn.
5. Then with a si
Subjects:
Grades:
4th - 7th
Types:
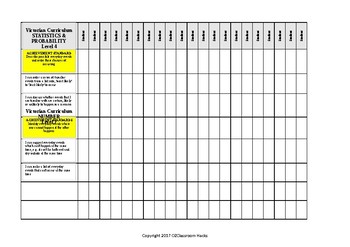
Mathematics STATISTIC PROBABILITY Checklist Level 4 Victorian Curriculum 'I Can'
Level 4 Statistics & Probability Checklist aligned with the Victorian Curriculum. Fed up with recreating new checklists - ME TOO! Here is a checklist completely aligned with the Victorian Curriculum, with 'I Can' statements breaking down each achievement standard.
These checklists can be used for assessment, reporting and for planning your curriculum so that you know you are covering everything set out in the Victorian Curriculum.
Each of these I Can statements can be used in your weekly pla
Subjects:
Grades:
2nd - 7th
Types:
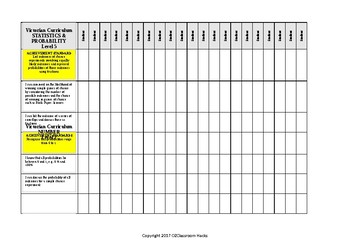
Mathematics STATISTICS and PROB Checklist Level 5 Victorian Curriculum in 'I Can
Level 5 STATISTICS and PROBABILITY Checklist aligned with the Victorian Curriculum. Fed up with recreating new checklists - ME TOO! Here is a checklist completely aligned with the Victorian Curriculum, with 'I Can' statements breaking down each achievement standard.
These checklists can be used for assessment, reporting and for planning your curriculum so that you know you are covering everything set out in the Victorian Curriculum.
Each of these I Can statements can be used in your weekly plann
Subjects:
Grades:
3rd - 7th
Types:
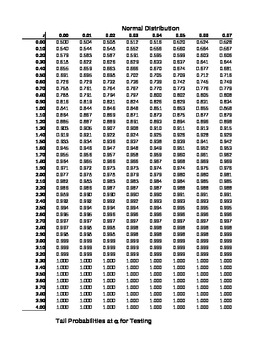
Z and t Distribution tables
Statistics t and Z distribution tables. The Z table is for the positive half of the standard normal curve. The tables were created for use with college statistics courses, but can be used with high school courses as well.
Subjects:
Grades:
11th - 12th, Higher Education
Types:

Overview of Mr. Bill's Store
I learned many years ago that the most effective way of keeping math engaging for students is through SELECTIVE PROBLEM SOLVING. All kinds of problem solving...not just traditional "solve this equation" problems. I will offer teachers ideas for keeping kids excited about math. Such as...building a probability distribution of outcomes from throwing dice...constructing a pendulum that will draw Lissajous figures...constructing a Foucault pendulum...how to do interesting large-scale astronomical
Subjects:
Grades:
5th - 12th
Types:
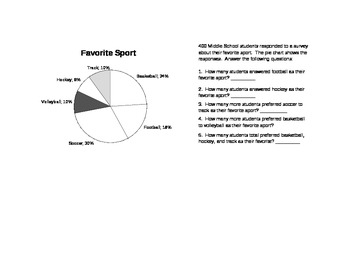
Pie Chart Practice
Printable Pie Charts from Microsoft Excel.
Have student evaluate the data in the chart and answer the provided questions.
Subjects:
Grades:
6th - 9th
Types:
Intramural Hockey Stat Sheet
Hockey stats sheet for intramural floor hockey
Subjects:
Grades:
4th - 12th
Types:
Also included in: Intramural Hockey Package
Showing 1-10 of 10 results


