310 results
Free 7th grade graphing resources for Microsoft Word
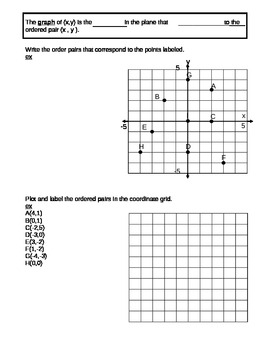
Coordinate Plane
This is a document that is used for guided notes for the Coordinate Plane. The notes practices how to plot points given ordered pairs, how to write the ordered pairs given the graph,and numbering the 4 quadrants.
Grades:
5th - 10th
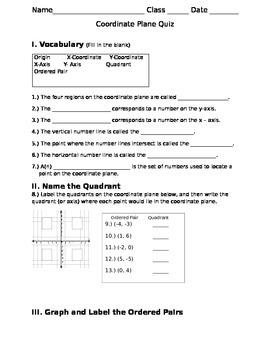
Coordinate Plane Quiz
Coordinate Plane Quiz includes:
-graphing ordered pairs
-identifying quadrants where points lie
-labeling all 4 quadrants
-writing ordered pairs to match points
-vocabulary
-three written response questions
Aligns to CCSS 6.NS.8 – Solve real-world and mathematical problems by graphing points in all four quadrants of the coordinate plane
Editable Microsoft Word document can be used as class work, homework, or an assessment.
Grades:
5th - 7th
Types:
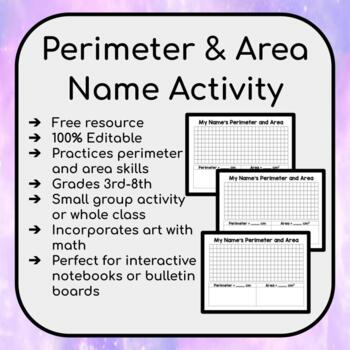
My Name: Perimeter and Area Activity
A fun math craft activity where student show off their area and perimeter skills! Print and go! Pro Tip: Post some examples or show YouTube videos on how to create block letters! I would always do this before starting the lesson :)
Grades:
3rd - 8th
Types:
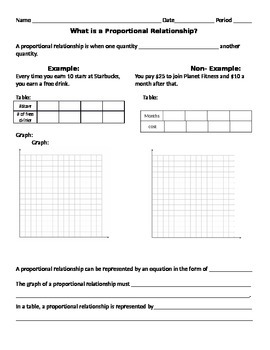
Graphing Proportional Relationships
This is a notes page I used to work through an example and non-example situation that can be represented in a table and a graph. The students had to decide whether or not it was a proportional relationship based on the table and the graph. The students seemed to enjoy it and found it very helpful in their understanding! Would be great for a short review or for a quick introduction!
Subjects:
Grades:
6th - 9th
CCSS:
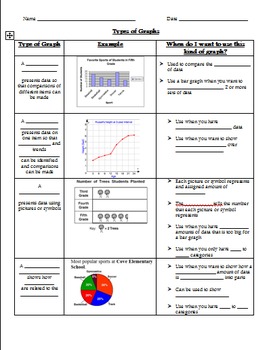
Types of Graphs Graphic Organizer
Multiple graphic organizers included. Students explore various types of graphs and learn about the characteristics and advantageous traits of each type, including line plot, histogram, line graph, circle graph, bar graph, stem-and-leaf plot, and double line graph. There are two types of graphic organizers included. The first is a basic graphic organizer that can also be used as an assessment in which students just identify the type of graph. In the second graphic organizer, students fill in key
Grades:
3rd - 7th
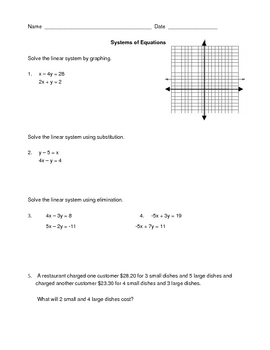
Solving Systems of Equations Three Ways
Here is a one page, 5 problem worksheet/quiz to give students to check their understanding of solving systems of equations using graphing, substitution, and elmination including a real world application word problem. Answer key is included.
Grades:
7th - 10th
Types:
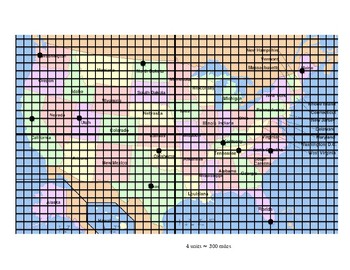
Distance and Midpoint Formula USA Map Assignment
This assignment provides students with practice on both the distance and midpoint formulas. In the assignment students will use the formulas to determine distances between states using a map converted into a coordinate plane. This assignment is great for middle school and high school geometry lessons.
Subjects:
Grades:
7th - 10th
Types:
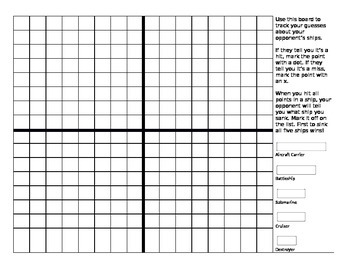
Battleship Game - Graphing Points on the Coordinate Plane
This game helps students review graphing coordinate pairs on the plane in all four quadrants. You will need one copy per student. Students play in pairs. Print out on cardstock and laminate to reuse with dry or wet erase markers year after year! Full text of related standards included.
TEKS 6.11
CCSS 6.NS.C.6b, 6.NS.C.6c
For personal classroom use only. Please direct other teachers to my TPT store rather than sending them the file. You may edit to fit your own classroom needs (font, rules, etc
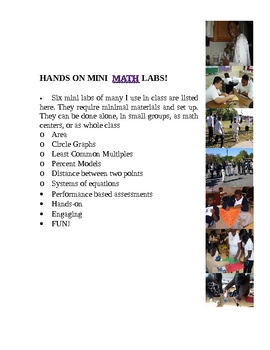
MATH : IDEAS for Hands-On Mini Activities in Middle School!
I have listed six of the many short labs we do in my Pre-Algebra and Algebra 1 classes. These labs take little or no set up with only a few basic materials. The kids love them because they can move around, work with a partner, and it breaks up the formality of a math class. These labs cover area of a parallelogram, percent models, circle graphs, distance between two points, coordinate graphing, parallel lines, systems of equations, graphing, data collection, LCMs, and the Pythagorean Theorem. Th
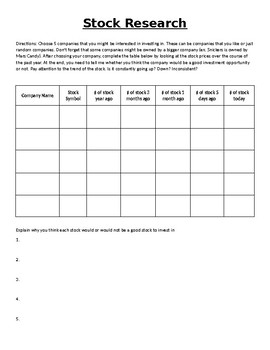
Stock Market Research
This activity goes great for classes that are studying the stock market. In this activity, students will find 5 companies and research the prices of their stocks over the past year. They will then have to explain why they think this stock is worth investing in or not. I am using this as a tool to help my students find stocks to invest in for our stock market game that they are playing online.
Subjects:
Grades:
7th - 12th
Types:
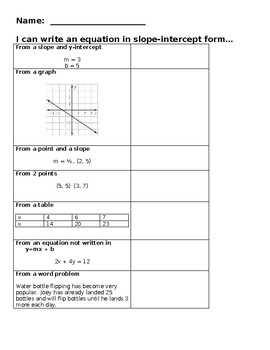
Writing Linear Equations in Slope-Intercept Form
This can be used as a quick warm-up or exit ticket to check for students ability to write equations in slope-intercept form given different information. Students are asked to write from a slope and a y-intercept, a slope and a point, two points, and a word problem. Students, also, need to rewrite an equation not given in slope-intercept form.
Subjects:
Grades:
7th - 10th
Types:
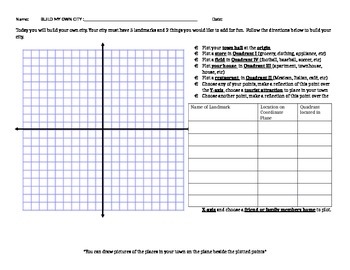
Build Your Own City- Coordinate Plane Activity
Students will practice plotting point, identifying points, and plotting reflective points on a coordinate plane, through designing their own city.
Students will have fun with this simple activity that allows teacher to assess student understanding of the coordinate plane and plotting.
*Word document that allows for altering*
Subjects:
Grades:
6th - 8th
Types:
CCSS:
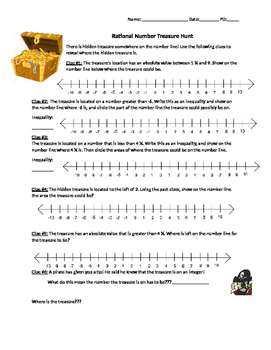
Rational Number & Absolute Value Treasure Hunt
Students must use their knowledge of absolute value to find the hidden treasure along the number line. After each clue they will shade the parts of the number line that the treasure could be hidden on. Using the clues together, students will have a very small portion of the number line shaded by clue #5. The final clue #6 gives students a clear idea where the treasure is hidden. Each clue requires students to understand absolute value. Students must also have prior knowledge of inequalities (<
Subjects:
Grades:
5th - 7th
Types:
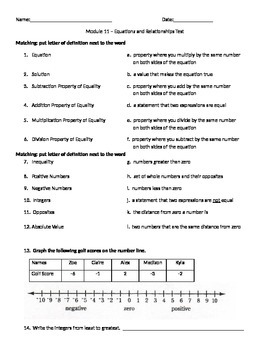
Common Core 6th Grade Math Equations and Inequalities Test
This test is similar to my Common Core 6th Grade Math Equations and Inequalities Study Guide. It has vocabulary matching, graphing and comparing of integers, absolute value, and equation writing and solving.
Grades:
5th - 7th
Types:
1cm x 1cm Grid Paper
Great to help students line up their numbers when needing to keep them in a place value. I use it for multiplication, division, addition, subtraction, place value and in a few other applications. It is especially effective with students with spacial learning challenges because it forces them keep their numbers lined up. It is a table that you can imput your numbers into to make it work for your students.
Subjects:
Grades:
1st - 9th
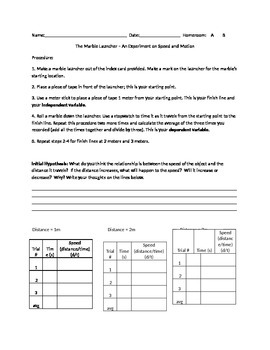
Speed and Motion Activity
In this activity, students measure the time it takes a marble to travel various distances, and use their recordings to calculate the speed of the object. They then have to summarize their findings, and create a position vs. time graph.
Subjects:
Grades:
6th - 8th
Types:
CCSS:
Manage Sports Statistics in Google Drive / Google Sheets - Activity
Use Google Sheets to analyze sports data
This activity lets students practice several fundamental spreadsheet skills, including:
-renaming documents
-adding formulas
-inserting / formatting charts
Screenshots demonstrate how to do all of the above in Google Sheets, the spreadsheet application in the Google Drive suite. You can add additional statistics to customize the assignment for your students and adjust the level of difficulty.
Aligned to the following Massachusetts Technology Literacy
Grades:
5th - 8th
Types:
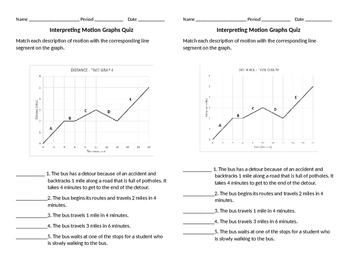
Interpreting Motion Graphs Quiz
This can be used as a quiz or activity to practice interpreting distance-time graphs. Students match description of motion to a distance-time graph. Corresponds with North Carolina Essential Standards 7.P.1.1, 7.P.1.3 and 7.P1.4.
Grades:
6th - 8th
Types:
Inequality Graphing Project (Making Tangrams)
(Files are no longer rendering properly on this site, and I do not have the original ones handy in order to fix them. Also, I do not see an easy way to simply make the product unavailable, so I will just make it free. My apologies if it shows up weird; you are welcome to make any tweaks that might help, of course.)Students graph two-variable inequalities then use the shaded regions to create tangrams. They will solve eight tangram puzzles using the pieces they have made. Once they have complet
Grades:
7th - 12th
Types:
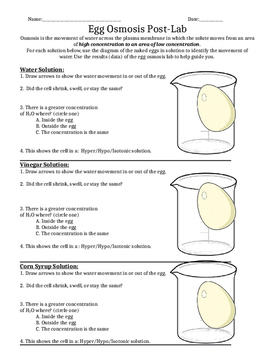
Egg Osmosis Lab Report
Editable Egg Osmosis Lab Report
Designed as a post-lab assessment for a lab that includes testing water, vinegar, and corn syrup as variable environments for vinegar soaked eggs.
Also includes graphing (percent change in weight of egg on initial day and end day) and analysis questions.
Subjects:
Grades:
5th - 12th
Types:
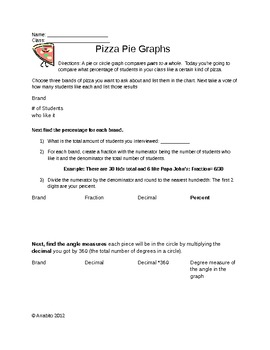
Pizza Pie Graphs Circle Graph Project
An in class project for middle school math with differentiation and rubric provided.
Aligned to 7th grade NYS and Common Core math standards.
Students survey to collect data and represent the data in a circle graph. The pizza theme makes it easy to let the students decorate their graph accordingly; makes a great bulletin board display!
The project is differentiated with two tiers. The less challenging project has fewer categories and more explicit directions and examples. The students will
Subjects:
Grades:
6th - 8th
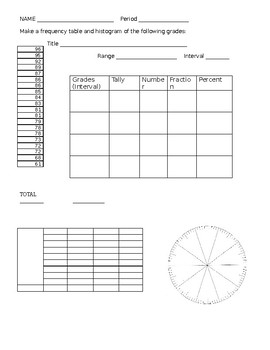
Intro to Frequency Tables - Histogram
This is a student friendly worksheets for students to learn how to collect data and make a frequency table and Histogram and circle graph. First page, set of grades are used as data, then students can fill in the frequency table.
Subjects:
Grades:
5th - 7th
Types:

Graphing Lines in Slope-Intercept Form
Here is a worksheet with practice problems for graphing linear equations using slopes and y-intercepts.
Nothing revolutionary...just thought I'd share. :)

Geometric Transformations: Radial Art
This project is a fun, creative, and real world way to incorporate geometric transformations. In this project student will began by making a rough draft of their art work on graph paper using step by step instructions. They will perform rotations, reflections, and translations. (You can also choose to include dilations). They can answer the questions pertaining to the transformations they made.They will make a final draft of their artwork using a blank canvas or another sheet of graph paper. The
Showing 1-24 of 310 results


