152 results
7th grade graphing worksheets for Easel
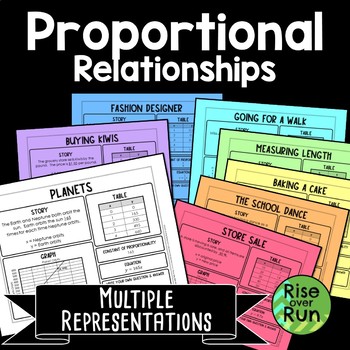
Proportional Relationships Graphing with Multiple Representations
These multiple representation math tasks help students make connections between graphs, tables, equations, and real world scenarios. Students are given a little information and must think how to fill in the rest!8 activity sheets each include: a story a grapha tableconstant of proportionalityan equation a space for students to write their own question and answer. A blank template is included as well so students can create their own proportional relationship.Multiple representations are a great w
Grades:
7th - 8th
Types:
Also included in: 8th Grade Math Activities & Lessons Bundle for the Whole Year

Writing Linear Equations in Slope Intercept Form Task Card Activity
Printable PDF, Digital & Easel by TPT Versions are included in this distance learning ready activity which consists of 10 Task Cards (with & without QR Codes) to help strengthen students’ skills in writing a linear equation in Slope Intercept form from a graph.Distance learning?No problem! This activity now includes Google Slides & Easel by TPT digital options!Explore the ⌨ Distance Learning in my store for more digital resourcesThree Forms of Use IncludedPrintable PDFGoogle SlidesEa
Grades:
7th - 9th
Types:
Also included in: 8th Grade Math Bundle ~ All My 8th Grade Math Products at 1 Low Price
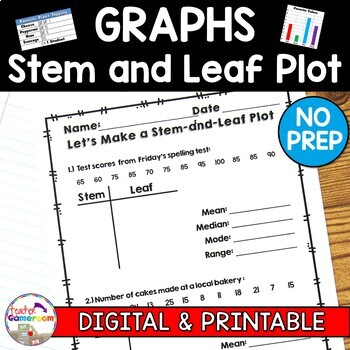
Making a Stem and Leaf Plot with Mean, Mode, Median, Range Worksheets
These worksheets allows students to make a stem and leaf plot using a given set of data. Student must build the plots on their own and then must find the mean, median, mode, and range of the data. There are 4 worksheets, each with 2 Stem and Leaf graphs to be made. Great for review or as a homework assignment. Full Page answer keys included. Extra licenses are $0.75.Questions/Materials include:✔️ 2 Questions per page✔️ 4 Worksheets✔️ 10 - 12 Numbers per graph✔️ 2-Digit and 3-Digit Numbers✔️ Rea
Grades:
4th - 8th
Types:
CCSS:
Also included in: Graphs Bundle | No Prep Digital Resources
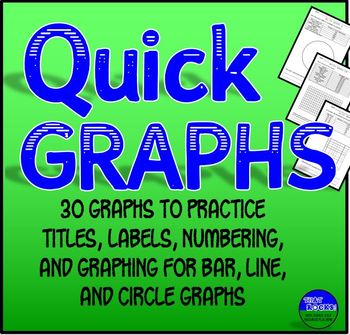
Graphing Practice 30 Quick Graph Sheets for Bar, Line, & Pie Graphs
Graphing Practice for Middle School! These are great to use as bellringers, exit tickets, or just extra practice, and work well for either a science class or math class.Using a data table, students supply the title, label the X- and Y-axes, practice finding appropriate number intervals, and make the graph. My average sixth grade students take 5 - 10 minutes per graph. The half-sheet format saves paper. Now available as ready-to-use EASEL activities!Each data table includes factual informatio
Grades:
5th - 8th
Types:
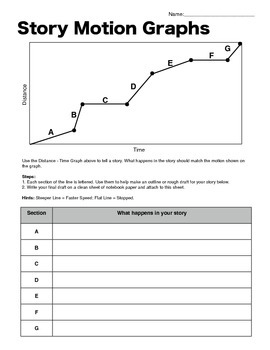
Story Motion Graphs - Distance-Time Graph Writing Activity
This writing activity will allow you to see how well students can interpret a distance-time graph, and let them use their imaginations as well.
Each section of the graph is labeled with a letter. In the table below, students can create an outline for their story that matches the motion graphed above. Then, they can write their final draft on a clean sheet. Even better: there is an advanced version for your higher-level thinkers. They must label the axis with units that match their story.
The
Grades:
5th - 8th
Types:
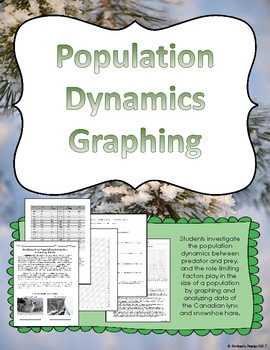
Predator and Prey Population Dynamics Graphing Activity
Students investigate the population dynamics between predator and prey, and the role limiting factors play in the size of a population by graphing and analyzing data of the Canadian lynx and snowshoe hare.I use this activity with my sixth grade students during our unit on ecosystems. We complete it as a class activity. You could make it an option in a choice project, a learning extension for higher level students, or an activity for a science center.The final page includes the completed graph
Grades:
5th - 8th
Types:
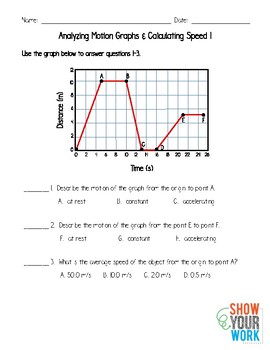
Analyzing Motion Graphs & Calculating Speed 1
This worksheet is a great addition to your Force & Motion unit for beginners! Students will analyze basic motion graphs (constant, at rest, accelerating), and calculate basic speed. Could also be used as a quiz.Now available as a self-checking EASEL ACTIVITY! Assign the Easel activity as practice and the hard copy worksheet as a quiz.Certified Easel Seller
Subjects:
Grades:
5th - 7th
Types:
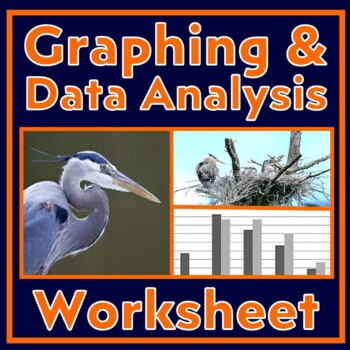
Data Analysis and Graphing Worksheet Scientific Method Practice (Herons)
Students build GRAPHING and DATA ANALYSIS skills. This activity provides a data table and an incomplete bar graph related to nesting habits of herons. Students follow directions that lead them through foundational graphing and data analysis skills. Instruction is built into the worksheet. This activity builds the following skills:Setting up bar graphs, including choosing intervals, labeling axes, and writing graph titles.Using data to make a bar graph (with an example already in place).Pulling
Subjects:
Grades:
6th - 9th
CCSS:
NGSS:
MS-LS2-2
, MS-LS2-1
, HS-LS2-1
, HS-LS2-2
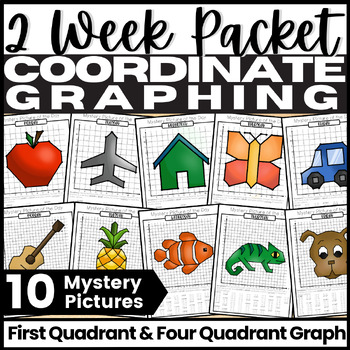
Coordinate Plane Mystery Pictures, First Quadrant and Four Quadrant Graph
If you're looking for highly engaging Coordinate Plane Mystery Pictures for your students, This. Is. It. This packet includes 10 Mystery Pictures and is differentiated by giving you the option of assigning Quadrant 1 Graph and/or all 4 Quadrants Graph. Get your students excited for math with this fun Coordinate Plane Mystery Picture of the Day Packet! This is a must-have packet for your Coordinate Graphing Unit. How is this Coordinate Plane Mystery Pictures Packet different from other Graphing a
Grades:
5th - 7th
Types:
CCSS:
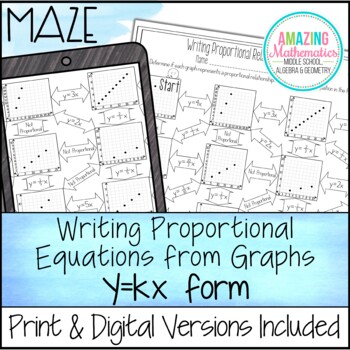
Writing Proportional Relationships From Graphs in y=kx Form Maze worksheet
Printable PDF, Google Slides & Easel by TPT Versions are included in this distance learning ready activity which consists of 11 problems where students must first determine if the graphs are proportional and then write the corresponding proportional equation in y=kx form. This maze will help strengthen your students’ skills at calculating the constant of variation (constant of proportionality) from a graph and writing the corresponding equation.Not all boxes are used in the maze to prevent
Grades:
7th - 8th
Types:
Also included in: 8th Grade Math Bundle ~ All My 8th Grade Math Products at 1 Low Price
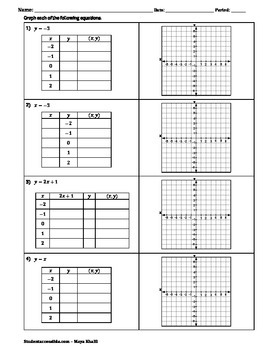
Graphing Linear and Nonlinear Equations with Tables of Values Worksheet
Two pages of graphing linear and nonlinear equations using tables of values. Some of these could be graphed with the slope and y-intercept. The equations are:y = -3 x = -3y = 2x +1 y = x y = x-squaredy = x-cubed y = |x| y = sqrt(x). The answer key is on pages 3 and 4.Make sure the printer does not shrink this resource. The preview above shows the answer key.
Grades:
7th - 10th
Types:
CCSS:
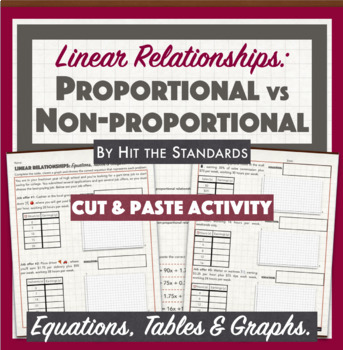
Proportional & Non-proportional Linear Relationships: Equations Tables Graphs
In this cut&paste activity, students must choose the best-paying job out of 5 given options. Each job salary represents a linear relationship, so students must complete a table, create a graph that represents each of them. Also, they must choose the correct equation (cut & paste) that represents each linear relationship. Finally, students must identify the relations as proportional or non-proportional. Hits CC Standards 7.RP.A.2, 8.EE.B.5, 8.F.B.4 & 8.F.B.5 Hits TEKS 8.4B, 8.5A, 8.5
Subjects:
Grades:
7th - 9th
Types:
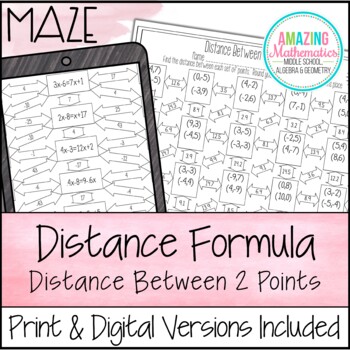
Distance Formula Worksheet - Maze Activity
Printable PDF, Google Slides & Easel by TPT Versions are included in this distance learning ready activity which consists of a maze where students will have to calculate the distance between two given points using the distance formula.Distance learning?No problem! This activity now includes Google Slides & Easel by TPT digital options!Explore the ⌨ Distance Learning in my store for more digital resourcesThree Forms of Use IncludedPrintable PDFGoogle SlidesEasel by TPTImportant Informatio
Grades:
7th - 10th
Types:
CCSS:
Also included in: Geometry Bundle ~ All My Geometry Products at 1 Low Price
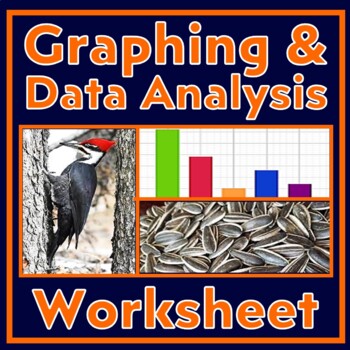
Graphing and Analyzing Data Activity with Scientific Method (Woodpeckers)
Use this data analysis and graphing worksheet to build GRAPHING and DATA ANALYSIS skills. This worksheet provides a data table from an experiment designed to find out which food woodpeckers prefer. Students follow directions that lead them through foundational graphing and data analysis skills, including making a bar graph and then analyzing it. Instruction is built into the worksheet. Students will practice the following skills in this activity:Setting up bar graphs, including choosing inter
Subjects:
Grades:
7th - 10th
CCSS:
NGSS:
MS-LS2-2
, MS-LS2-4
, HS-LS2-2
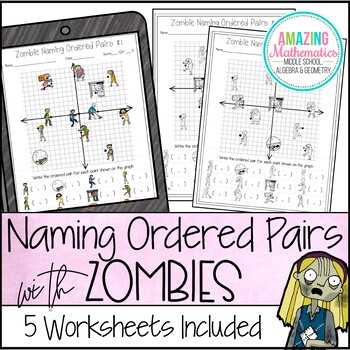
Zombie Naming Ordered Pairs Worksheet
These 5 Zombie themed worksheets provide fun & engaging coordinate graphing practice for Halloween or any time of the year. Each worksheet includes a colored or black and white graph with 12 Zombies on it that each have an associated plotted point. Students must name the ordered pair that goes with each image. Three Forms of Use IncludedPrintable PDFGoogle SlidesEasel by TPTAnswer key is included for easy grading.Please view the preview for an exact view of the worksheet to ensure this pr
Subjects:
Grades:
5th - 8th
Types:
Also included in: Naming Ordered Pairs - Worksheet Bundle
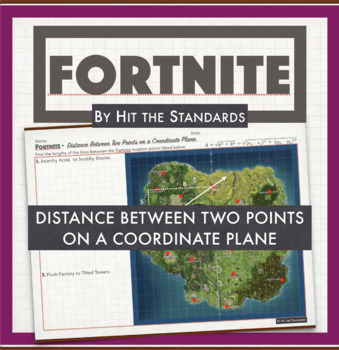
FORTMATH - Distance Between Two Points on a Coordinate Plane
In Fortnite - Distance Between Two Points on a Coordinate Plane activity students will use the distance formula to calculate the lengths of the lines between the given Fortnite location points on the map. There are 10 problems in total! Perfect practice for your students using the distance formula with this trendy video game theme!Hits Common Core Standards 6.NS.C.6c, 6.NS.C.8, 8.G.B.8, HSG-GPE.B.7, and TEKS 8.7D.
Grades:
7th - 12th
Types:
CCSS:
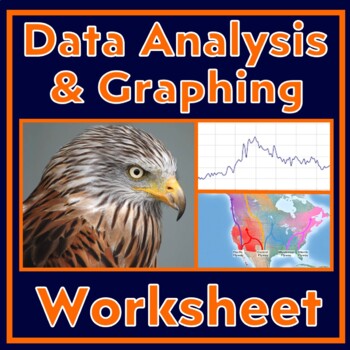
Scientific Method Worksheet Graphing and Data Analysis Practice (Falcons)
Use this data analysis and graphing worksheet to build GRAPHING and DATA ANALYSIS skills. This worksheet provides a data table about the distances that falcons travel. Students follow directions that lead them through graphing and data analysis skills, including making a line graph and then analyzing it.Instruction is built into the worksheet.Students will practice the following skills in this activity:Setting up line graphs, including choosing intervals, labeling axes, and writing graph titles.
Subjects:
Grades:
6th - 9th
CCSS:
NGSS:
MS-LS2-2
, MS-LS2-1
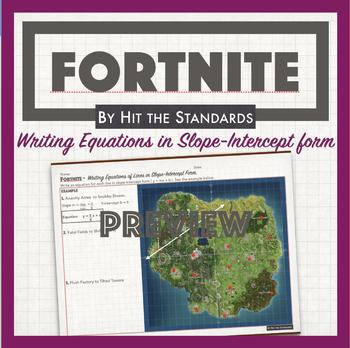
FORTMATH - Writing Equations of Lines in Slope-Intercept Form Math Game Activity
Keep your students engaged and learning with this Fortnite - Writing Equations of Lines in Slope-Intercept Form, which consists of writing an equation for each line formed by two different Fortnite location points in slope-intercept form ( y = mx + b ). One example is provided. Just print & Go!Hits Common Core Standards 8.EE.B.5, and TEKS 8.4C and A.2B.Assess the quality of my work with this free resource!✔ Excellent for class or homework! ✔ Just print and go! ✔ Answer key included!☀ Do you
Subjects:
Grades:
7th - 12th
Types:
CCSS:
Also included in: Rate of Change or Slope & Y-intercept Math UNIT 4 BUNDLE! 30% OFF
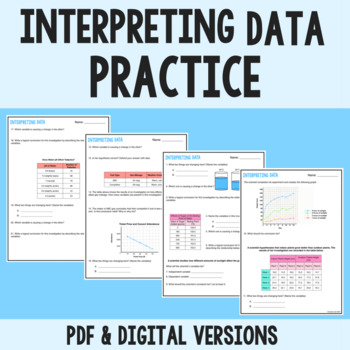
Interpreting Data Practice
Do your students struggle with finding meaning behind the data they’re collecting? Are many of your students still struggling with independent and dependent variables? If you answered yes to either of those questions, then this resource is for you! Skills covered in this resource include:Identifying variables in graphs and data tablesDetermining the relationship between variables Who is this resource for?This resource can be used by classroom teachers, tutors, and parents of students in grades 6
Subjects:
Grades:
6th - 9th
Types:
Also included in: Science & Scientific Method - FULL UNIT
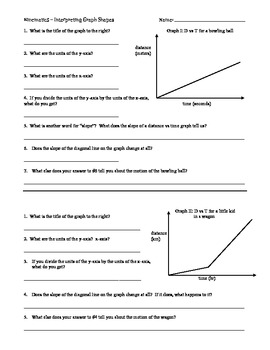
Graphing - Interpreting Distance vs Time Graphs
This worksheet gives students 4 distance vs time graphs and a series of questions about each to lead them through reading graphs. The main goal is to hammer home the point that slope = velocity.This is the second in my set of worksheets on graphing that will lead students through the basics of constructing graphs, interpreting the meaning of graphs, and calculating quantities from graphs.This is ideal for physical science classes where the students are in pre-algebra or algebra 1.
Subjects:
Grades:
7th - 9th, Adult Education
Types:
Also included in: Graphing Bundle
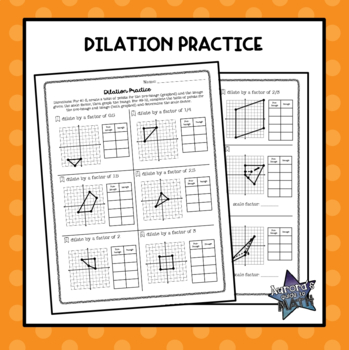
Dilation Practice
Dilation PracticeThis no-prep resource is a great way to get students to practice skills related to a geometric dilation! This resource contains a two-page practice activity containing 12 problems. For eight problems, students will perform a dilation given a graph of the original figure and a scale factor. For the last four problems, students are given a graph of the pre-image and image for a figure, and asked to determine the scale factor for the dilation that occurred. This is a great way for
Grades:
6th - 12th
Types:
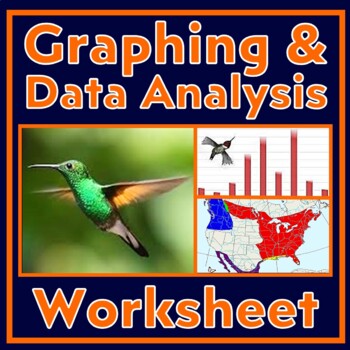
Scientific Method Worksheet Graphing and Analyzing Data Activity (Hummingbirds)
Build GRAPHING and DATA ANALYSIS skills! This worksheet provides a data table related to hummingbird migration. Students follow directions that lead them through graphing the data and analyzing it. Students will practice the following skills in this activity:Setting up bar graphs, including choosing intervals, labeling axes, and writing graph titles.Generating a bar graph from provided data.Pulling data from their graph.Data analysis that requires using data as evidence to support conclusions.R
Grades:
7th - 10th
CCSS:
NGSS:
MS-LS2-4
, MS-LS2-1
, HS-LS2-1
, HS-LS2-2

Graphing Practice
This worksheet is designed to give students practice creating graphs in Excel or Google Sheets from a data table but can also be used with regular paper and pencil! This resource is geared slightly towards science, and the final two pages prompt students to examine what the scientists who collected this data may have been studying and what their variables are. Outliers are mentioned at one point as well.Students are prompted to create:1 line graph1 circle graph1 bar graph1 scatterplot1 graph of
Subjects:
Grades:
5th - 8th
Types:
Also included in: Science & Scientific Method - FULL UNIT
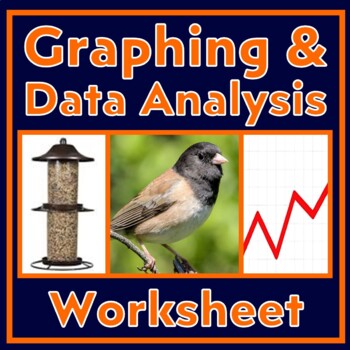
Graphing and Data Analysis Worksheet Scientific Method Practice (Juncos)
DATA ANALYSIS and GRAPHING ACTIVITY: Build science skills with real world data! This worksheet provides a data table and a line graph related to the months that one bird species visit bird feeders. Students follow directions that lead them through foundational graphing and data analysis skills. Students are not expected to make a graph from scratch, but are provided a scaffolded approach to practice these skills. Instruction is built into the worksheet. Students will practice the following
Subjects:
Grades:
6th - 9th
NGSS:
MS-LS2-2
, MS-LS2-4
Showing 1-24 of 152 results


