22 results
7th grade graphing assessments for Easel
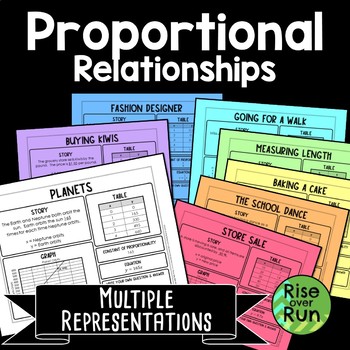
Proportional Relationships Graphing with Multiple Representations
These multiple representation math tasks help students make connections between graphs, tables, equations, and real world scenarios. Students are given a little information and must think how to fill in the rest!8 activity sheets each include: a story a grapha tableconstant of proportionalityan equation a space for students to write their own question and answer. A blank template is included as well so students can create their own proportional relationship.Multiple representations are a great w
Grades:
7th - 8th
Types:
Also included in: 8th Grade Math Activities & Lessons Bundle for the Whole Year
Writing, Graphing & Solving One-Step Inequalities - Distance Learning Options
This worksheet, available as a PDF or Digital Worksheet, includes questions on writing, graphing, and solving one-step inequalities. Students need to translate verbal phrases, including one word problem; graph inequalities on the number line; write inequalities given a graph; and solve one-step inequalities involving addition, subtraction, multiplication, and division. Problems include positive and negative numbers along with several fractions and decimals. There are no inequalities where st
Subjects:
Grades:
5th - 7th
Types:
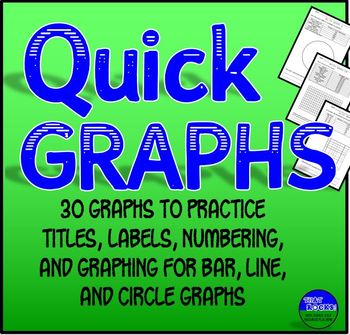
Graphing Practice 30 Quick Graph Sheets for Bar, Line, & Pie Graphs
Graphing Practice for Middle School! These are great to use as bellringers, exit tickets, or just extra practice, and work well for either a science class or math class.Using a data table, students supply the title, label the X- and Y-axes, practice finding appropriate number intervals, and make the graph. My average sixth grade students take 5 - 10 minutes per graph. The half-sheet format saves paper. Now available as ready-to-use EASEL activities!Each data table includes factual informatio
Grades:
5th - 8th
Types:
Dilations Initials Project - Project Based Learning with Digital Easel Activity
Dilations Initials Project.This is a culminating project for a unit on dilations. Students enlarge and shrink a drawing of their initials on grid paper or poster-board and use coordinate graphing rules to produce a similar image. In addition, they enlarge the image and it must have a scale factor of at least 4. Then they shrink the image and it must have a scale factor of at most 1/4. Good activity for project-based learning. Digital and Print: Includes an Easel Activity ready for learning with
Subjects:
Grades:
6th - 9th
Types:
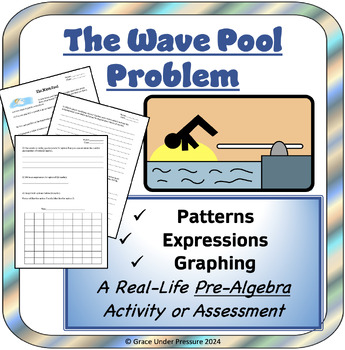
Wave Pool Patterns, Expressions, Graphing: Real-Life Pre-Algebra Problem Gr 5-7
Here is a ready-to-print real world math activity for a pre-algebra unit in grades 5-7 including expressions, tables of values, and graphing. • This activity lets students explore pattern rules, expressions, and line graphs using a real-life scenario that is of interest to them: getting the best deal on a pass to a local wave pool.• Read through the activity as a class after you have been working on a patterning or pre-algebra unit.• This can be used as an in-class assignment, weekly homework ta
Subjects:
Grades:
5th - 7th
Types:
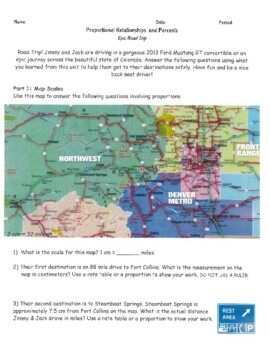
Road Trip! Proportions, Percents, Constant of Proportionality Performance Task.
This fun performance task can be used as an interim or summative assessment. It assesses proportional reasoning, direct variation or constant of proportionality, and percents (emphasis on percent proportion). Students also have to make connections between the problems and reflect on their journey. Ideal for 6th, 7th or 8th grade/ Pre-Algebra.Includes answer key!Great for distance, hybrid, or in person learning and posting to Google Classroom. Digital copy available! Thanks for viewing!
Subjects:
Grades:
6th - 8th
Types:
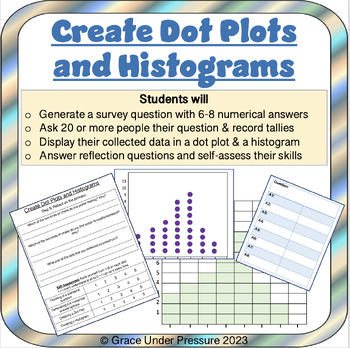
Create Dot or Line Plots and Histograms: Display Numerical Data 6th Grade Stats
Help your 6th grade and middle school math students learn about statistics, data collection, and data presentation in a hands-on and meaningful way! In this product students will:- Generate their own survey question with 6-8 numerical answers (samples included)- Ask 20 or more people their question & record answers in a tally chart- Display their collected data in a dot plot or line plot and then a histogram (the blank templates are included so all students can be successful)- Answer reflect
Subjects:
Grades:
5th - 8th
Types:
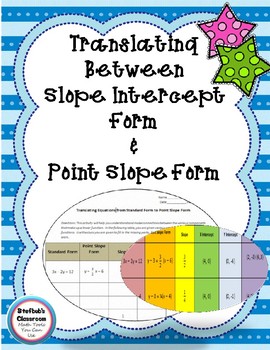
Translate Equations from Standard Form to Slope Intercept Form
In this activity, students are given various clues such as the standard form of the equation of a line, point slope form, slope, x intercept, y intercept, and 2 random points. They are to use the given information to find the remaining missing information. This activity is a great way for students to demonstrate understanding and connections between these different components of a linear function. The activity can be used as an enrichment for a lower grade level Algebra class, practice for an
Subjects:
Grades:
7th - 11th
Types:
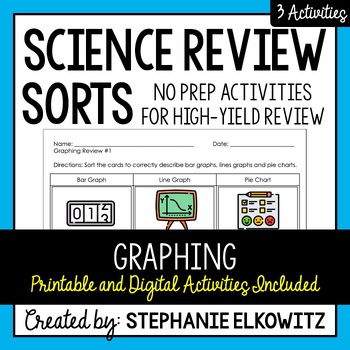
Graphing Review Sort | Printable, Digital & Easel
A NO-PREP resource to review HIGH-YIELD topics in science! My science review sorts help students develop mastery of science concepts, review difficult concepts and avert common misconceptions and misunderstandings. Each individual review sort will target a specific topic. By doing so, students focus their attention and effort on advancing their understanding of scientific ideas and concepts related to that topic. Important Notes:• Download a FREE High-Yield Review Activity• Save $$ with the Natu
Grades:
5th - 10th
Types:
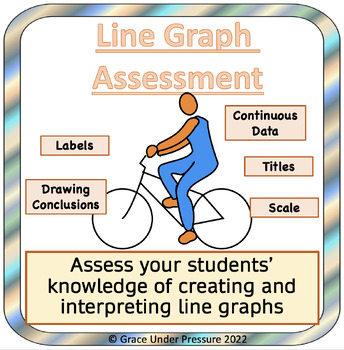
Line Graph Assessment: scale, labels, interpreting, continuous vs. discrete data
This activity uses data from a realistic scenario (a bike ride) to assess students’ graphing and interpreting skills when working with line graphs.Assesses if students can:- determine a reasonable scale- create and properly label a line graph- explain how data was collected- differentiate between discrete and continuous data- interpret a line graph- draw reasonable conclusions from a set of data- identify information between data pointsAn answer key included for easy marking out 20 points!This p
Subjects:
Grades:
4th - 8th
Types:
Halloween Hunt - Finding objects on a coordinate plane,
This was designed for use by 8th graders to be able to determine the coordinates of objects on a coordinate plane, then use the Pythagorean theorem to find the distance between some of the objects. Other grades may be able to use this as an introduction to the coordinate plane etc.
A suggestion for calculating square roots without a calculator is given on the last page.
Subjects:
Grades:
6th - 9th
Types:
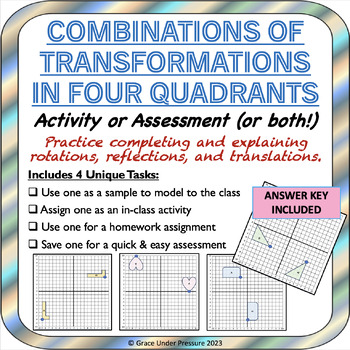
Transformations in 4 Quadrants: Translations, Rotations, Reflections w/ Integers
This geometric transformations activity can be used in many ways in your grade 6-8 math class! Help your students practice completing and explaining rotations, reflections, and translations as they move Shape A to Shape B on a four quadrant grid. They will learn how to specifically describe their transformations by identifying lines of reflection, axes of rotation, direction and amount of rotation, and direction and amount of translation. They will also sketch the intermediate shapes on the grid
Grades:
6th - 9th
Types:
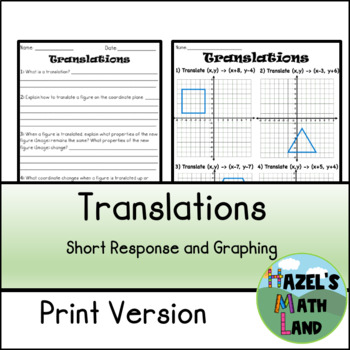
Translations: Short Response and Graphing (Print Only)
Assess your students understanding of translations in two types of way. This resource includes four worksheets. Two of the worksheets are short response questions. Students are asked to explain their understanding of translations. For those students that dislike writing, the other two worksheets require the students to graph a translation and identify a translation rule from a graph.ABOUT THIS RESOURCE8 pages 2 short response worksheets. 8 questions2 graphing worksheets, 8 questionsThis resource
Grades:
6th - 9th
Types:

Math Project Linear Functions and/or Systems of Linear Functs. Project *DISTANCE
PRINT and DIGITAL * * Makes distance planning so much easier!Linear Functions and/or Systems of Linear Functions ProjectThis math project is a fun way for your students to apply mathematical reasoning of linear equations and/or systems of linear equations in a real-world situation that is highly engaging! Your junior high or high school students will love the anticipation of the triathlon teen race real world situation as the events unfold! TPT buyers said, "Great project source!" "Great reso
Subjects:
Grades:
6th - 11th, Adult Education
Types:
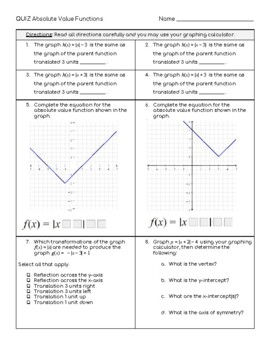
Characteristics of Absolute Value Functions Quiz
This quiz has 12 questions that vary from fill in the blank, select all that apply, multiple-choice, and open-response. There is an answer key included. The questions assess students' ability to do the following:Describe translations from an absolute value equation. Write an equation from an absolute value function with translations. Select the correct equation for a graph of an absolute value function with transformations. Determine the vertex from an absolute value equation. Determine the axis
Grades:
7th - 10th
Types:

Independent vs. Dependent Variables - Create Your Own
This is an assignment that walks students through creating their own mathematical scenario with an independent and dependent variable. Students will write the scenario, identify the variables, and create a table and graph. I have also included a rubric for grading. This could be used as a formative assessment to check understanding of independent and dependent variables, or as a more summative project.
Subjects:
Grades:
6th - 7th
Types:
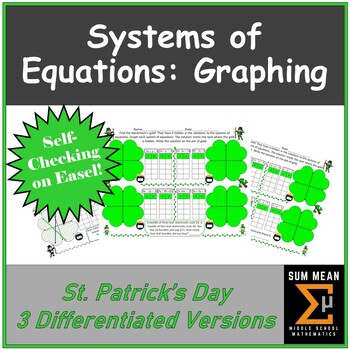
Systems of Equations: Graphing Solutions (Differentiated) | St. Patrick's Day
Are you looking for a fun, differentiated way to practice solving systems of equations by graphing! Students will enjoy helping the leprechauns find their pots of gold! Included:Easel enabled with self-checking Drag and Drop for the solutionsThree unique differentiated pagesFour systems of equations to solve per page Color or Black and White versionsHow could you use it?Give different versions to each student based on their strengths with graphing and solving equationsGive an entire class versio
Subjects:
Grades:
7th - 9th
Types:
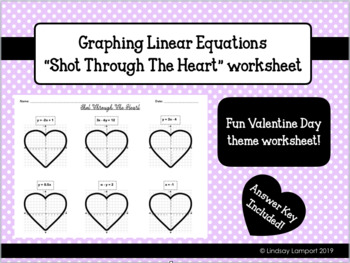
"Shot Through The Heart" Linear Graphing worksheet
Fun, Valentine themed worksheet for practicing linear graphing. Six problems and graphs are given. Students are to graph an arrow through the heart that corresponds to the given equation. Mixed equations: standard form and y-intercept form. Answer key is included, enjoy!
Grades:
7th - 12th
Types:
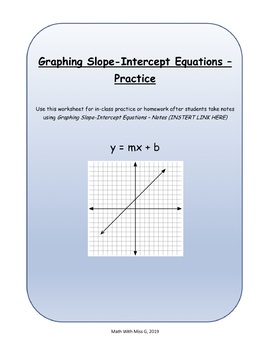
Graphing Slope-Intercept Equations - Practice
Give your students practice graphing basic slope-intercept equations (positive or negative slopes only, no zero or undefined slopes). This worksheet is perfect for in-class practice or homework, and is designed to be used with Graphing Slope-Intercept Equations - Notes. Answer key included.
Subjects:
Grades:
7th - 12th
Types:
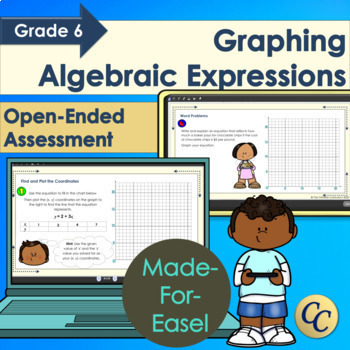
Graphing Algebraic Expressions | An Interactive, Open-Ended Assessment
Graphing Algebraic Expressions is a 'Made-for-Easel' Assessment - that means all you have to do is assign! Covers solving for x or y, plotting coordinates, word problems, and developing equations for real-world problems. Uses open-ended Bloom's Taxonomy style questions to get the most out of each student. Specifically designed to be used digitally, so this resource is: full color, interactive, 16:9 ratio and perfect for remote learning or a 'take-home test'. ⏰ About 1 class of work. Slides inc
Subjects:
Grades:
6th - 7th
Also included in: Canadian Grade 6 Math Bundle | For Print and Easel
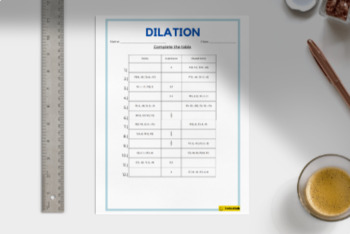
Dilation Table
12 Practice problems finding the coordinates of the pre image, image as well as the scale factor.
Dilations Intro Notes and examples (no graphs)
Introduce Dilations with Notes and examples.
Grades:
6th - 9th
Showing 1-22 of 22 results


