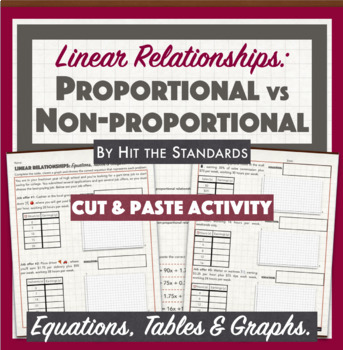
Proportional & Non-proportional Linear Relationships: Equations Tables Graphs
- PDF
- Easel Activity
What educators are saying
Also included in
- SAVE MONEY & TIME with this AMAZING BUNDLE! Proportional & Non-proportional Functions & Unit Rate Bundle prepare students to demonstrate and master their understanding of proportional and non-proportional situations, and identifying functions. This unit address students’ ability to identPrice $17.82Original Price $25.45Save $7.63
Description
In this cut&paste activity, students must choose the best-paying job out of 5 given options. Each job salary represents a linear relationship, so students must complete a table, create a graph that represents each of them. Also, they must choose the correct equation (cut & paste) that represents each linear relationship. Finally, students must identify the relations as proportional or non-proportional.
Hits CC Standards 7.RP.A.2, 8.EE.B.5, 8.F.B.4 & 8.F.B.5
Hits TEKS 8.4B, 8.5A, 8.5B, 8.5F and 8.5H.
✔ Excellent for class or homework!
✔ Just print and go!
✔ Answer key included!
☀ Do you want your school to buy this product for you?
Click on this link and send a message to your administrator about TpT for Schools
❤ How to earn TPT credits to use on future purchases:
Please go to your My Purchases page. Beside each purchase you'll see a Provide Feedback button. Simply click it and you will be taken to a page where you can give a quick rating and leave a short comment for the product. You can check your credit balance in your TpT Credit Balance page. Every 100 Credits is worth $5 that you can apply towards future TpT purchases in my store, or any TpT store.
★ Be the first to know about my new products, discounts, and freebies:
Look for the green star next or below to my store logo and click it to become a follower. You’ll receive customized email updates about this store, and be the first to know when new products are added (including FREEBIES!).
✿ Licensing Terms:
Purchase of this unit entitles the purchaser only the right to reproduce the pages in limited quantities for classroom use only. Duplication for an entire school, an entire school system or commercial purposes is strictly forbidden without written permission from the publisher. Licenses are non-transferable and therefore can not be passed from one teacher to another. No part of this resource is to be shared with colleagues or used by an entire team, grade level, school or district without purchasing the correct number of licenses. If you are a coach, principal or district interested in transferable licenses that would accommodate yearly staff changes, please contact me for a transferable license quote at lily_135@hotmail.com.
Copyright Information:
© Erika Hernandez, Hit the Standards.
All rights reserved.
Thank you ❣


