18 results
7th grade graphing independent work packets for Easel

Data Analysis and Graphing Worksheet Scientific Method Practice (Herons)
Students build GRAPHING and DATA ANALYSIS skills. This activity provides a data table and an incomplete bar graph related to nesting habits of herons. Students follow directions that lead them through foundational graphing and data analysis skills. Instruction is built into the worksheet. This activity builds the following skills:Setting up bar graphs, including choosing intervals, labeling axes, and writing graph titles.Using data to make a bar graph (with an example already in place).Pulling
Subjects:
Grades:
6th - 9th
CCSS:
NGSS:
MS-LS2-2
, MS-LS2-1
, HS-LS2-1
, HS-LS2-2
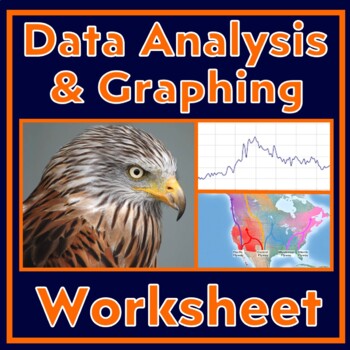
Scientific Method Worksheet Graphing and Data Analysis Practice (Falcons)
Use this data analysis and graphing worksheet to build GRAPHING and DATA ANALYSIS skills. This worksheet provides a data table about the distances that falcons travel. Students follow directions that lead them through graphing and data analysis skills, including making a line graph and then analyzing it.Instruction is built into the worksheet.Students will practice the following skills in this activity:Setting up line graphs, including choosing intervals, labeling axes, and writing graph titles.
Subjects:
Grades:
6th - 9th
CCSS:
NGSS:
MS-LS2-2
, MS-LS2-1
Graphing and Analyzing Data Activity with Scientific Method (Woodpeckers)
Use this data analysis and graphing worksheet to build GRAPHING and DATA ANALYSIS skills. This worksheet provides a data table from an experiment designed to find out which food woodpeckers prefer. Students follow directions that lead them through foundational graphing and data analysis skills, including making a bar graph and then analyzing it. Instruction is built into the worksheet. Students will practice the following skills in this activity:Setting up bar graphs, including choosing inter
Subjects:
Grades:
7th - 10th
CCSS:
NGSS:
MS-LS2-2
, MS-LS2-4
, HS-LS2-2
Scientific Method Worksheet Graphing and Analyzing Data Activity (Hummingbirds)
Build GRAPHING and DATA ANALYSIS skills! This worksheet provides a data table related to hummingbird migration. Students follow directions that lead them through graphing the data and analyzing it. Students will practice the following skills in this activity:Setting up bar graphs, including choosing intervals, labeling axes, and writing graph titles.Generating a bar graph from provided data.Pulling data from their graph.Data analysis that requires using data as evidence to support conclusions.R
Grades:
7th - 10th
CCSS:
NGSS:
MS-LS2-4
, MS-LS2-1
, HS-LS2-1
, HS-LS2-2
Graphing and Data Analysis Worksheet Scientific Method Practice (Juncos)
DATA ANALYSIS and GRAPHING ACTIVITY: Build science skills with real world data! This worksheet provides a data table and a line graph related to the months that one bird species visit bird feeders. Students follow directions that lead them through foundational graphing and data analysis skills. Students are not expected to make a graph from scratch, but are provided a scaffolded approach to practice these skills. Instruction is built into the worksheet. Students will practice the following
Subjects:
Grades:
6th - 9th
NGSS:
MS-LS2-2
, MS-LS2-4
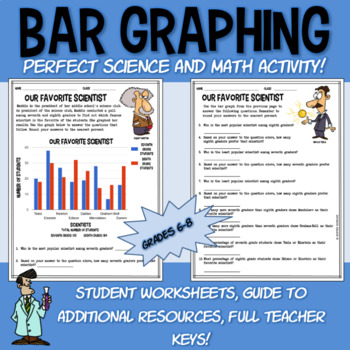
Bar graphing worksheet DIGITAL & PRINTABLE middle school elementary science math
Reinforce bar graphs, graphing, calculating percentages, and graph interpretation with this fun graphing activity! This science themed worksheet is perfect as a review prior to an exam or standardized test. Students interpret data presented on a bar graph and answer questions that require them to read the graph correctly and calculate percentages. Check out the PREVIEW for an idea of everything included in this engaging lesson!I created this lesson for my middle school students, but several tea
Grades:
4th - 8th
Scientific Method Worksheet Graphing and Analyzing Data Activity (Tadpoles)
Build GRAPHING and DATA ANALYSIS skills! This worksheet provides a data table related to tadpoles and the pH of water. Students follow directions that lead them step-by-step through graphing the data and analyzing it.Students will practice the following skills in this activity:Setting up bar graphs, including choosing intervals, labeling axes, and writing graph titles.Generating a bar graph from provided data.Pulling data from their graph.Data analysis that requires using data as evidence to sup
Grades:
6th - 9th
CCSS:
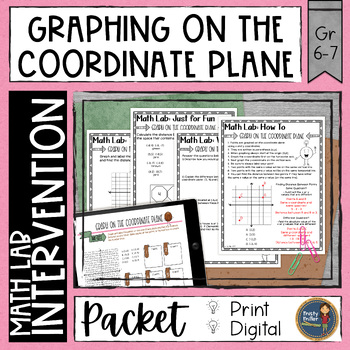
Graph on the Coordinate Plane Math Activities Lab - Math Intervention - Sub Plan
Do your students need help with graphing on the coordinate plane? This math intervention packet will help your students learn to plot points on all 4 quadrants of the coordinate plane, find distance between points, and practice through math problems. You'll be able to give a pre-assessment, provide step-by-step directions for plotting on number lines & coordinate planes, provide practice, and assess at the end.☺ Get the money saving BUNDLE: Math Activities Lab Bundle ☺Graphing on the Coordin
Grades:
6th - 7th
CCSS:
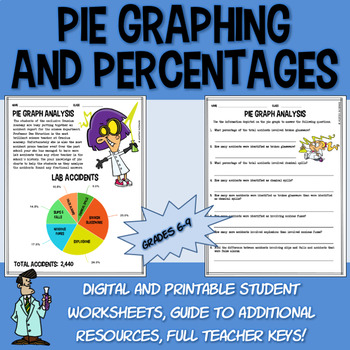
Pie graph & percentages worksheet DIGITAL & PRINT Middle School science math
Reinforce pie graphs, calculating percentages, and graph interpretation with this fun science themed activity! This worksheet is perfect as a review prior to an exam or standardized test. Check out the PREVIEW for an idea of everything included in this engaging lesson!I created this lesson for my middle school students, but several teachers on my campus have used it with their younger high school students. Perfect for math and science classrooms! I always feel the need to review graphing and wor
Grades:
6th - 9th
Circulatory system digital activities, worksheet, 7th grade science
Inspire independent consolidation, with this Digital interactive game designed to help your students master the concepts, structures and functions of the heart and circulation. There are five interactive activities (25 questions) to complete. Each activity will test for understanding of keywords, question types and applying knowledge to graphs.The colorful game is self-correcting, providing feedback after each activity. All five activities must be completed to win the game. Students succeed as
Subjects:
Grades:
6th - 9th
CCSS:
NGSS:
MS-LS1-3

Practice Reading Graphs - USA Today, DISTANCE LEARNING, EASEL ACTIVITY
*** UPDATED FOR DISTANCE LEARNING *** I've done the work for you! This worksheet is ready for you to assign to your students via Google Classroom. Answer boxes are in place and ready for student input. The Answer Key has been removed in the digital activity, but you can still access it in the pdf version. This digital activity presents 10 graphs from the popular "USA Today Snapshots" to provide practice with all aspects of reading graphs - interpreting data, drawing conclusions, recognizing sou
Subjects:
Grades:
6th - 9th, Adult Education
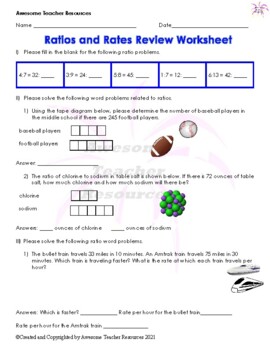
Ratios and Rates Review Sheet
This comprehensive review sheet contains problems related to ratios numerically and as word problems. As well, there are word problems which require students to graph their answers. It is predominantly word problems with real world situations. There is an answer key.
Subjects:
Grades:
6th - 8th
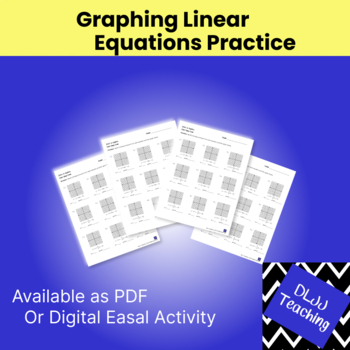
Writing and Graphing Linear Equations Worksheets or Digital Easel Activity
These worksheets give students more practice with writing equations from a graph and graphing equations that are in slope-intercept form and point-slope form. These can also be used as a partner practice activity.Four worksheets are included:Worksheet #1 - Writing equations in slope-intercept form given the graphed line.Worksheet #2 - Graphing equations that are in slope-intercept form.Worksheet #3 - Writing equations in point-slope form given the graphed line.Worksheet #4 - Graphing equations t
Grades:
7th - 9th
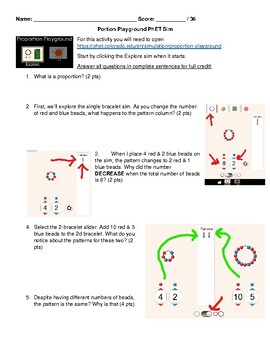
Proportion Playground PhET Activity for Ratios
Proportions are mathematically hard to visualize, and can be difficult to see how the ratio of one to another impacts the proportions. Proportion Playground is a free sim from PhET that lets you quickly explore proportions. In this activity you'll play with paint balloons, beads and pool tables to see how different proportions relate to each other. Please check that PhET in HTML5 will work on your digital device BEFORE purchasing. Java applets may not work in some browsers.
Subjects:
Grades:
6th - 12th, Higher Education, Adult Education
NGSS:
MS-ETS1-2
, HS-ETS1-2
, HS-ETS1-3
, MS-ETS1-4
, MS-ETS1-1
...
Also included in: TinkerCAD 3D Printing Lesson Bundle
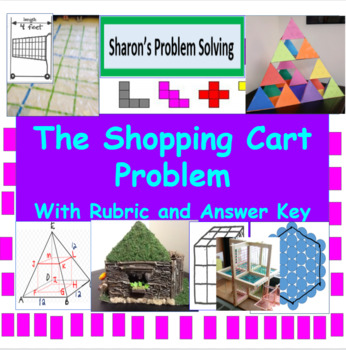
The Shopping Cart Problem and rubric
The Shopping Cart Problem is a challenging linear pattern/function problem. Students are asked to complete x/y tables, calculate slope, write linear equations, and solve an equation to maximize a solution. The rubric can be used by the students and/or teacher. The answer key is included.The problem lends itself to TpT Easel and can be completed online.
Subjects:
Grades:
6th - 12th
CCSS:
Also included in: Linear Topics Bundle
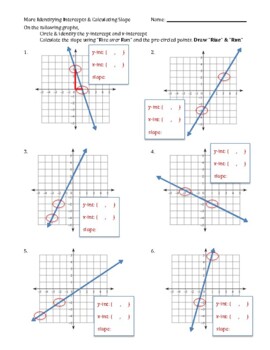
Graphing - More Identifying Intercepts & Calculating Slope with KEY
This is a set of 12 graphs for students to practice identifying x & y intercepts as well as calculating slope using "Rise over run" that I have my students complete after walking them through the "Meaning of Graph features notes" (part of the 'Graphing Notes' packet).The board notes typically take about the first half of an 80 minute class and this assignment takes them the 2nd half of the class (~30 min) and serves as their exit ticket. In classes that can stay on task, I have students work
Grades:
7th - 9th
Also included in: Graphing - Notes + Associated activities
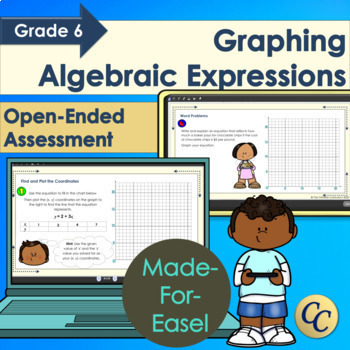
Graphing Algebraic Expressions | An Interactive, Open-Ended Assessment
Graphing Algebraic Expressions is a 'Made-for-Easel' Assessment - that means all you have to do is assign! Covers solving for x or y, plotting coordinates, word problems, and developing equations for real-world problems. Uses open-ended Bloom's Taxonomy style questions to get the most out of each student. Specifically designed to be used digitally, so this resource is: full color, interactive, 16:9 ratio and perfect for remote learning or a 'take-home test'. ⏰ About 1 class of work. Slides inc
Subjects:
Grades:
6th - 7th
Also included in: Canadian Grade 6 Math Bundle | For Print and Easel
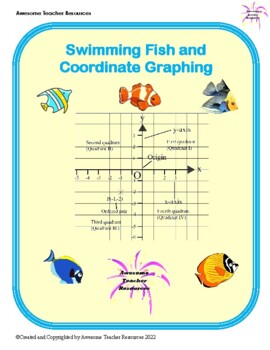
Swimming Fish Coordinate Grid Practice Worksheet
This worksheet has a number of fish in a four quadrant graph. Students are to write the coordinates for the fish in the table on the second page of the worksheet. Then they must determine which quadrant has the most of each kind of flower. In addition to the worksheet, there are some helpful notes to suggest other graphing and coordinate plane activities that could be engaged in by students. There is an answer key.
Subjects:
Grades:
5th - 7th
Showing 1-18 of 18 results


