3 results
7th grade graphing laboratories for Easel

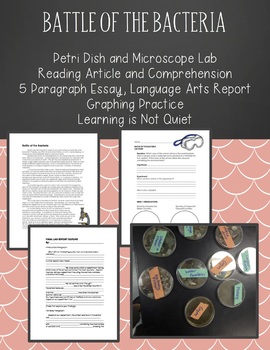
Battle of the Bacteria Cells Petri Dishes (Article, experiment, report)
Battle of the Bacteria Video / Lesson Plan Explained: https://www.youtube.com/watch?v=OAXqaKTLoRcWhether you teach upper elementary or middle school, it can be difficult to fit all of the subjects in a given day. With this activity, it makes it simple to teach math, writing, reading, health, and of course science together with one experiment. (I have done this activity as a 5th grade and 7th grade teacher).In this activity, students go throughout the school and collect samples of places that t
Subjects:
Grades:
5th - 7th
Types:

Scientific Method Activity Practice Data Analysis Qualitative and Quantitative
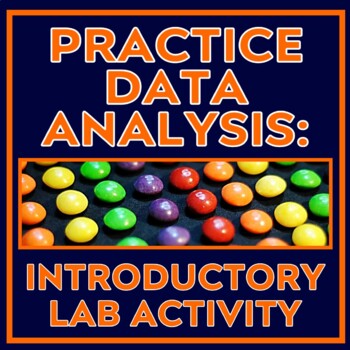
This activity has students collect QUALITATIVE and QUANTITATIVE DATA about the candy in a mixed pack, such as Skittles or M&Ms. There are many candy activities out there, but none quite covered the quantitative and qualitative skills I wanted my middle school students to practice, so I designed my own! This lab is designed to be simple so that students can master beginner lab and data collection skills.In this activity, students will:READ an article about the differences between qualitativ
Subjects:
Grades:
6th - 8th
Types:
Also included in: Introduction to Experimentation Activity Set for Middle School Science

Bread Mold Experiment
This activity was used to go along with a "Characteristics of Living Things" unit. This product contains directions for setting up an experiment that explores how moisture affects the rate of mold growth on bread. Students are required to identify the parts of the experiment, form a hypothesis, and collect data over the course of 1-2 weeks. This product also contains a graphing component, where students create a double line graph to show how moisture affected mold growth over the course of th
Subjects:
Grades:
5th - 8th
Types:
Showing 1-3 of 3 results


