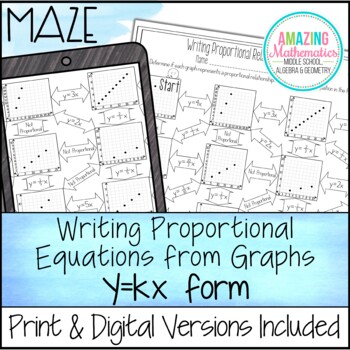
Writing Proportional Relationships From Graphs in y=kx Form Maze worksheet
- PDF
- Google Apps™
- Easel Activity

What educators are saying
Also included in
- This bundle includes all the notes, worksheets, & activities in my store that pertain to 8th Grade Mathematics.Does this Include Digital Resources?As of June 2024 over 80% of this bundle includes a digital Google Slides or Forms option.Please view the preview to view the content list & whichPrice $115.00Original Price $222.50Save $107.50
- This bundle includes all the notes, worksheets, & activities in my store that pertain to 7th Grade Mathematics.Does this Include Digital Resources?As of June 2024 over 75% of this bundle includes a digital Google Slides or Forms option.Please view the preview to view the content list & whichPrice $144.00Original Price $160.00Save $16.00
- This bundle includes all the mazes in my store that pertain to 7th Grade Mathematics. Important InformationIf you own the 7th Grade Math Bundle, DO NOT BUY this bundle. These mazes are included in the 7th Grade Math Bundle.Three Forms of Use Included for Each MazePrintable PDFGoogle SlidesEasel byPrice $43.05Original Price $61.50Save $18.45
- This bundle includes all the mazes in my store that pertain to 8th Grade Mathematics. Important InformationIf you own the 8th Grade Math Bundle, DO NOT BUY this bundle. These mazes are included in the 8th Grade Math Bundle.Three Forms of Use Included for Each MazePrintable PDFGoogle SlidesEasel byPrice $46.20Original Price $66.00Save $19.80
Description
Printable PDF, Google Slides & Easel by TPT Versions are included in this distance learning ready activity which consists of 11 problems where students must first determine if the graphs are proportional and then write the corresponding proportional equation in y=kx form. This maze will help strengthen your students’ skills at calculating the constant of variation (constant of proportionality) from a graph and writing the corresponding equation.
Not all boxes are used in the maze to prevent students from just guessing the correct route. In order to complete the maze students will have to correctly solve 10 proportional relationship problems.
Distance learning?
- No problem! This activity now includes Google Slides & Easel by TPT digital options!
- Explore the ⌨ Distance Learning in my store for more digital resources
Three Forms of Use Included
- Printable PDF
- Google Slides
- Easel by TPT
What’s Included
Maze & Answer Key
Important Information
Please view the preview for an exact picture of what this maze looks like if you are unsure that this product is right for your classroom.
Related Resources
Proportional vs Non-Proportional Card Sort & Homework
Similar Activities
o Click Here for more Math Mazes
o Click Here for more 7th Grade Math activities
This product is also part of the following money saving bundles:
7th Grade Math Bundle - All My 7th Grade Math Products for 1 Low Price
8th Grade Math Bundle - All My 8th Grade Math Products for 1 Low Price
Texas Information
This product is not Texas Specific but if you are a Texas teacher it covers the following TEKS:
7.4A – Represent constant rates of change in mathematical and real-world problems given pictorial, tabular, verbal, numeric, graphical, and algebraic representations
7.4C – Determine the constant of proportionality within mathematical and real-world problems
8.5A - Represent linear proportional situations with tables, graphs, and equations in the form y=kx
Find the resource you need quickly & easily....
Download the FREE Amazing Mathematics Resource Catalog Today!
- Resource Catalog - 6th Math
- Resource Catalog - 7th Math
- Resource Catalog - 8th Math
- Resource Catalog - Algebra
- Resource Catalog - Geometry
-------------------------------------------------------------------------------------------------------
©Copyright Amazing Mathematics LLC
This product is to be used by the original purchaser only.
This product can NOT be uploaded to the internet by the purchaser.
Doing so is a violation of the copyright of this product.
Copying for more than one teacher, or for an entire department, school,
or school system is prohibited.
This product may not be distributed or displayed digitally for public view, uploaded to school or district websites, distributed via email, or submitted to file sharing sites.
The unauthorized reproduction or distribution of a copyrighted work is illegal.
Criminal copyright infringement, including infringement without monetary gain, is investigated by the FBI and is punishable by fines and federal imprisonment.


