44 results
Adult education graphing resources for Easel
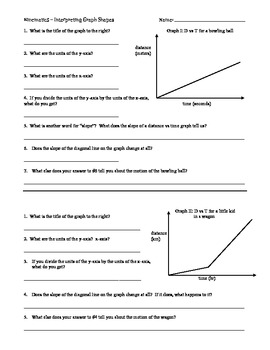
Graphing - Interpreting Distance vs Time Graphs
This worksheet gives students 4 distance vs time graphs and a series of questions about each to lead them through reading graphs. The main goal is to hammer home the point that slope = velocity.This is the second in my set of worksheets on graphing that will lead students through the basics of constructing graphs, interpreting the meaning of graphs, and calculating quantities from graphs.This is ideal for physical science classes where the students are in pre-algebra or algebra 1.
Subjects:
Grades:
7th - 9th, Adult Education
Types:
Also included in: Graphing Bundle
Task Cards Reading Graphs: Line Graphs, Bar Graphs, and Pie Chart: Revised
40 Task Cards. Teach your students how to read and interpret a line graph, bar graph, or pie chart from a word problem or given data. Challenge your students to think more critically and become better mathematicians. Start your students on their
way to becoming better problem graphic interpreters.
A teachers guide entitled “Learn to Read Graphs” is included. An answer guide for each activity is also provided.
Some common core standards met by this activity will be:
CCSS.Math.
Subjects:
Grades:
3rd - 9th, Adult Education
Types:

ACT Math Test Prep for Algebra Geometry Number Sense
This ACT math resource has 26 questions covering the following topics: functions, algebraic and geometric transformations, graphing, exponent rules, slope, midpoint, quadratic formula, geometric sequences and more! The answer key comes with explanations for each problem! Standards are included so student can determine weaknesses. If you want a combination of SAT, PSAT, ACT and ACCUPLACER and TSI, then check out the Mega Bundle below:COLLEGE TEST PREP MEGA BUNDLE - 3 BUNDLES IN ONE!Copyright © Ti
Grades:
9th - 12th, Higher Education, Adult Education
Types:
Also included in: ACT Math Test Prep Bundle

Interpreting Graphs for the Middle & Junior High School: Book 2
Here is another set of data graphics for your students to analyze and interpret. Using survey results from the USA Today newspaper, students will be asked to explain what the graphics are illustrating. Each activity will ask the student to identify basic information presented in each graphic and make some projections based on the data given in the survey.
The activities in this packet are a great way to improve your student’s skills in taking apart graphic displays of information. Brin
Subjects:
Grades:
4th - 10th, Adult Education
Types:
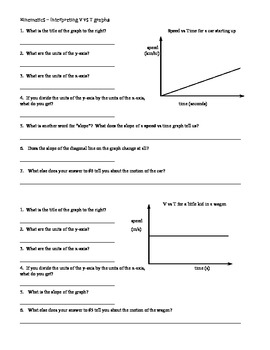
Graphing - Interpreting Velocity vs Time Graphs
I use this worksheet on velocity vs time graphs as a followup to the distance vs time graphs before introducing the kinematic equations. This is primarily for an introductory physical science class or lower level physics class. The goal is to guide students through looking at details of graphs and think about what the graphs mean physically. Key is included as pages 3 and 4.
Subjects:
Grades:
8th - 10th, Adult Education
Types:
Also included in: Graphing Bundle
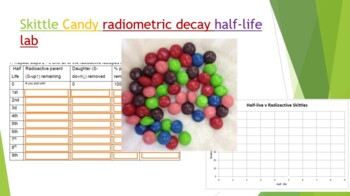
Skittle Radiometric Decay Half-life Lab
Did you know you can use Skittles candy to demonstrate absolute dating and radiometric decay! Buy a 1-4 lb bag at your local bulk warehouse store for savings. This lab is a great way to show how isotopes decay by shaking a plate full of random skittles. Students use Skittles to observe "Isotopes" decay over each half life. At the end of the lab (and only IF they have done all their work) they can enjoy their "daughter products". Skittles were used because they are durable, hypoallergenic, and th
Subjects:
Grades:
8th - 12th, Higher Education, Adult Education
Types:
NGSS:
HS-PS1-8
, HS-PS1-1
, HS-PS1-4
, HS-PS1-6
, MS-PS1-4
...
Also included in: Hands-on Science Semester Labs Bundle

Linear Functions Interpret Rate of Change in RealWorldSituations *DISTANCE LRNG.
PRINT and DIGITAL * * Makes distance planning so much easier!Linear Functions Interpret Rate of Change in Real World SituationsLinear Functions Interpret Rate of Change in Real World Situations, has 10 different real world situations that require students to think critically about linear functions. The real world situations get more challenging as students progress through each situation. TPT buyers said, "Great resource.", "Great resource. I like particularly how they get more challenging.",
Subjects:
Grades:
7th - 11th, Adult Education
Types:
CCSS:

Math Project Linear and Exponential Functions Which Salary? *DISTANCE LEARNING
PRINT and DIGITAL * * Makes distance planning so much easier!Linear and Exponential Functions Math Project: Which Salary Would You Choose?Are you looking for a way for you students to show you they can model linear and exponential functions with a real world application? Linear and Exponential Functions Math Project: Which Salary Would You Choose?, is just what you need. TPT buyer said, "Great resource".In this project students will model salary situations involving linear and exponential func
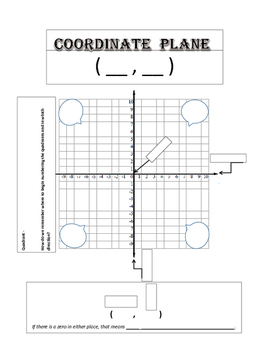
Coordinate Plane Graphic Organizer
This is a graphic organizer that I made for my students' interactive notebook. The students label each part of the coordinate plane and have visual clues to help them. This is a great review before moving on to graphing points, graphing lines, transformations on the coordinate plane, etc.
Grades:
5th - 12th, Higher Education, Adult Education, Staff
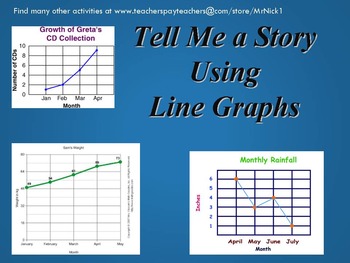
Tell me a Story using Line Graphs
Teach your students how to write across the curriculum. Want to know what your students are thinking? Here is a set of activities that will do just that. Hand out the graphic picture and the worksheet to each student or as a group assignment and ask them to complete the task. The observer or person looking at the graph is asked to tell a story presented in the graph. This packet gives each student the opportunity to “describe or tell the story” they see. You may then ask them to present th
Subjects:
Grades:
5th - 12th, Adult Education
Types:
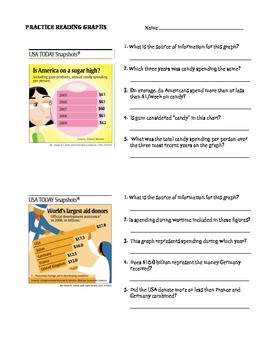
Practice Reading Graphs: USA Today FREEBIE, DISTANCE LEARNING, EASEL ACTIVITY
*** UPDATED FOR DISTANCE LEARNING***Assign to your students via Google Classroom, Answer boxes are already provided for your students to input their answers. The Answer Key has been removed in the digital activity, but you can still access it in the pdf version.This digital activity presents 4 graphs from the popular "USA Today Snapshots" to provide practice with all aspects of reading graphs (3 bar graphs, 1 pie chart) - interpreting data, drawing conclusions, recognizing sources, etc. Th
Subjects:
Grades:
6th - 9th, Adult Education
Types:
Math Project Graphing Systems of Equations Math & Art Project *DISTANCE LEARNING
PRINT and DIGITAL * * Makes distance planning so much easier!Graphing Systems of Equations Math and Art ProjectYour students will apply their skills of graphing systems of linear equations with art! Students will graph specified types of systems of linear equations and choose how they create an original piece of art. My students love this project because it provides an opportunity for them to be creative in math class!This project is a great formative assessment because it assesses students’ s
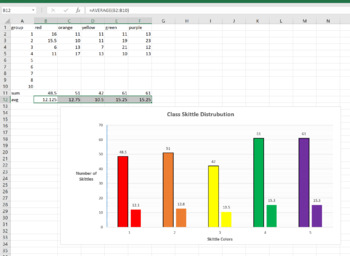
Skittle Statistics MS Excel Mini-Lab
This is a 1 class MS Excel lab for a computer or math class. You can have the students explore the distribution of different color Skittles in class. This is a great mini-lab or half-day activity when you school ends up with a weird schedule day. Tell them they can't eat till the Skittles till the end of class, or they will distort their numbers. Also make sure they don't throw them or shove them up their nose (Yes, stuck Skittles are hard to extract, ask me how I know..)The goal of this lab is
Grades:
6th - 12th, Higher Education, Adult Education
Types:
NGSS:
MS-ETS1-2
, HS-ETS1-2
, HS-ETS1-3
, MS-ETS1-4
, MS-ETS1-1
...
Also included in: Hands-on Science Semester Labs Bundle
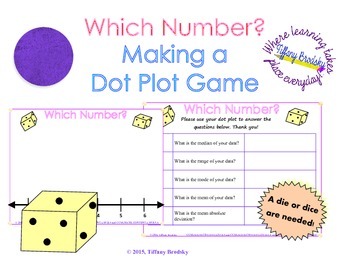
Dot Plot Graphing and Worksheet Activity (or Game)
A fantastic activity for practice after teaching mean, median, range, and mean absolute deviation. Students roll a die and plot their own graphs. Wonderful! What's Included:PDF for easy printing (color and black and white copy; you choose the best for printing)activity formatted for Easel (this is a pen activity)(You will need one die per person or group. This is not included.)This is an activity which you can simply print and set in a math center or give as an assignment. This game or activ
Subjects:
Grades:
5th - 7th, Adult Education
Types:

Practice Reading Graphs - USA Today, DISTANCE LEARNING, EASEL ACTIVITY
*** UPDATED FOR DISTANCE LEARNING *** I've done the work for you! This worksheet is ready for you to assign to your students via Google Classroom. Answer boxes are in place and ready for student input. The Answer Key has been removed in the digital activity, but you can still access it in the pdf version. This digital activity presents 10 graphs from the popular "USA Today Snapshots" to provide practice with all aspects of reading graphs - interpreting data, drawing conclusions, recognizing sou
Subjects:
Grades:
6th - 9th, Adult Education
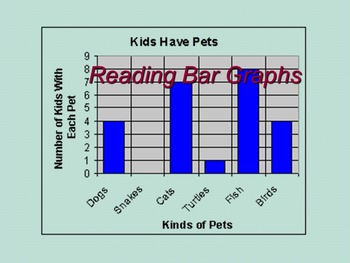
Reading a Bar Graph: meeting the Common Core.
Here is an activity to challenge your students into a higher thinking level from the traditional basics. “Reading a Bar Graph” will introduce your student into interpreting graphs using a step by step guide. “Reading a Bar Graph” will present the teacher with an option of introducing their students to interpret these graphs by applying a step by step a power point format or PDF format.
Use the step by step power point guide on a smart board, overhead projection system, or board & wo
Subjects:
Grades:
2nd - 12th, Adult Education
Types:

Math Project Systems of Equations RealWorld Sales Representative *DISTANCE LEARN
PRINT and DIGITAL * * Makes distance planning so much easier!Systems of Equations Real World Application Sales Representative Math ProjectDo you want your students to apply their skills solving systems of equations to a real world situation? In my Systems of Equations Real World Application Sales Representative Math Project your students will learn how to interpret the “real world meaning” of the y-intercept, the “real world meaning” of the point of intersection, and the rate of change. They w
Subjects:
Grades:
8th - 11th, Adult Education
Types:

Creating Graphs from Data:Meeting the Common Core
Creating a graph to represent data gives us a better picture of what the numbers are trying to tell us. Using a step-by-step approach, this activity will demonstrate for each student how to generate various types of graphs and plots to interpret given data. Terms such as range, class, frequency, interval, pie charts, histograms, and line graphs are introduced to assist the student in creating and understanding these graphs. After introducing the terms and a class discussion has taken place,
Subjects:
Grades:
4th - 12th, Higher Education, Adult Education
Types:
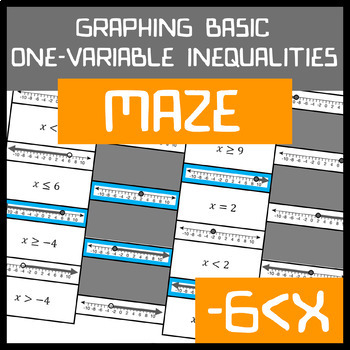
Graphing Basic One-Variable Inequalities Maze
Graphing Basic One-Variable Inequalities MazeThis activity will strengthen and challenge your students’ skills in graphing basic one-variable inequalities involving greater than, less than, greater than or equal to, and less than or equal to.Students are tasked with observing basic one-variable inequalities and recognizing each inequality's line graph. This activity offers students the opportunity to develop and/or master their ability to demonstrate precision when graphing. Upon finishing, stud
Subjects:
Grades:
6th - 12th, Higher Education, Adult Education
Types:
CCSS:

Interpreting Graphs: Meeting the Common Core: Booklet 3
Want to improve your student’s skills in interpreting graphs. Here is a wonderful set of activities to help your students better analyze graphs. Meet the required Common Core standards with this product. This packet contains 5 activities plus a more advanced graphic to be analyzed. An answer guide is provided to better assist you with each activity. Common core standards include 6.SP.B.4.
Some additional activities you may wish to check out: (Just click on the link provided)
Title: Task C
Subjects:
Grades:
4th - 8th, Adult Education
Types:
CCSS:
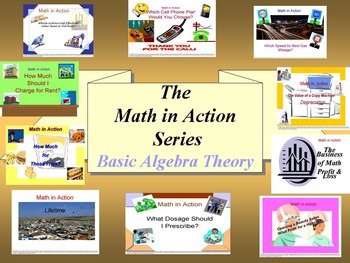
The Math in Action Series: Basic Algebra Theory
Bundled for Savings (under 90 cents per activity) over the individual product price. This newly revised bundle presents a detailed format permitting more student involvement and comprehension of basic Algebraic theory.
I created each activity to reinforce the theory of graphing data, calculating an equation that best fits the data, and formulating a conclusion. This set of activities provides each student with the objective behind the theory of algebra and its usefulness in the Real Worl
Subjects:
Grades:
6th - 11th, Adult Education
Types:

Graph Linear Equations using Slope and x-& y-intercepts Practice *DISTANCE LEARN
PRINT and DIGITAL * * Makes distance planning so much easier!Graphing Linear Equations using slope and x- and y-interceptsGraphing Linear Equations using Slope and x- and y-intercepts Practice/Review has 25 problems with no prep required by you! These problems are perfect for giving your students the practice they need to master graphing linear equations using slope and x- and y-intercepts. They are also great for sub days because there is no prep for you!Your students will practice graphing l
Grades:
7th - 11th, Adult Education
Types:
Linear Functions Exploring How "m" & "b" Affect the Graph of the Line *DISTANCE
PRINT and DIGITAL * * Makes distance planning so much easier!Graphs of Linear Functions Exploring How "m" and "b" Affect the Graph of a Linear FunctionHow do "m" and "b" affect the graph of the line of a linear function?Do you want your students to understand how changing the values of the slope and y-intercept if a linear equation change the graph of the line? TPT buyers said, "Great resource thank you!" "Good lesson. Thank you!" and"I teach high school ESL. This resource really provided add
Subjects:
Grades:
7th - 9th, Adult Education
Types:
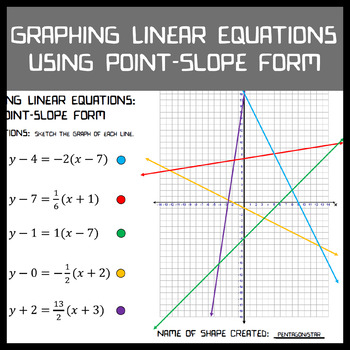
Graphing Linear Equations: Point-Slope Form
Graphing Linear Equations: Point-Slope Form ActivityThis activity will strengthen and challenge your students’ skills in graphing lines using Point-Slope Form.Students are tasked with graphing five equations written in Point-Slope form. This activity offers students the opportunity to develop and/or master their ability to demonstrate precision when graphing. Upon finishing, students' graphs will display a shape that students must identify.A student's graph not yielding an accurate shape notifie
Subjects:
Grades:
6th - 12th, Higher Education, Adult Education
Types:
CCSS:
Showing 1-24 of 44 results


