29 results
Graphing worksheets for Microsoft Excel
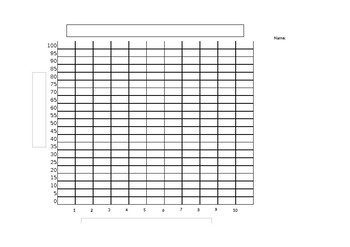
Blank (line or bar) Graph
This product can be for multiple uses! It contains a numbered x and y axis, a blank heading for students to write in a title, and blank headings for axis labels.I used the blank graph for my students to graph their test scores and then mark their goal for their next test creating an accountability factor for testing.
Grades:
Not Grade Specific
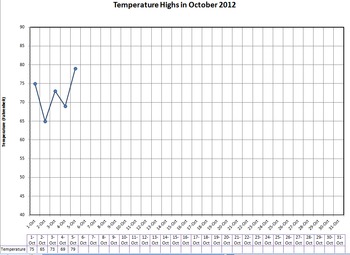
Graph Daily Temperature - with handout
Lots of downloads, are there any comments or votes for me? :)
Type in the daily temperature on your computer with your students and it will automatically graph it for you as you type. You can pre-print the monthly graph for everyone in your class and they can follow along and graph with you. I use it with calendar math or other daily activities.
Great for explaining the scales of a graph and practicing accuracy in graphing and using rulers to connect lines. Look for trends in weather and a
Subjects:
Grades:
3rd - 6th
Types:
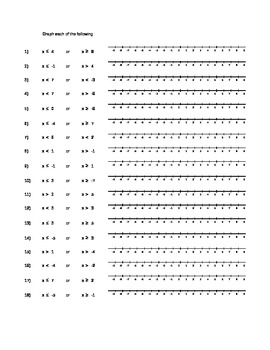
Compound Inequality Graphing Practice
This excel spreadsheet includes a sheet of practice for both AND and OR compound inequalities. There are also three sheets of blank number lines, so that a teacher could write their own inequalities for students to graph.
Grades:
5th - 9th
Types:
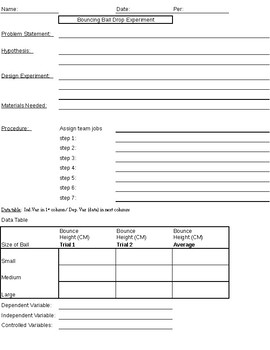
Science: Simple Bouncing Ball Experiment With Data Table & Graph Practice
This simple experiment can be used in open inquiry by giving students three different sized balls and a meter stick so they can design their own experiments. Included (all black & white pages - easy to copy): (1) teacher reference page to give students much or little guidance.(2) pages for students to write a problem statement, hypothesis, experiment design, materials needed, procedure, data table (for independent and dependent variables), an area for a graph, and conclusion. Some Ideas F
Subjects:
Grades:
Not Grade Specific
Types:
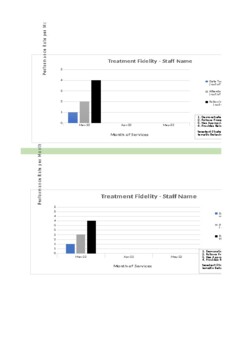
Fidelity Check with Graphs (Short)
Keep track of staff and treatment fidelity without distractions with this (weekly/monthly) checklist. Graphing is automatic and will generate based on the formula. Fully customizable to your companies specific goals and needs.
Subjects:
Grades:
Staff
Types:
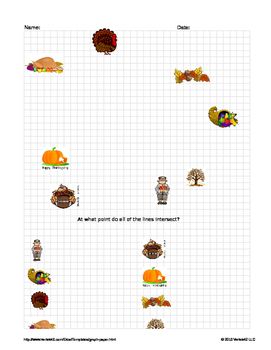
Point-Slope Form Turkey Hunt (Thanksgiving)
use this activity with your students to practice Point-Slope form. Worksheet comes as an excel file with different options. You can have students draw given lines that hit each of the graphics on graph and find the intersecting point OR have students create their own lines that hit each of the graphics and write an equation for those lines.
This is a quickly put together activity, I will go back and edit it for beauty and glamour over the break weekend :)
Grades:
8th - 12th
Types:
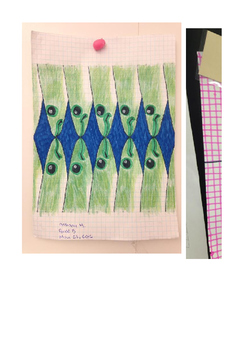
Parabola Art
this is a great activity to do after teaching the vertex form of the quadratic equation. Also very good for understanding 'domain.' Kids construct 10 parabolas based on specific domain. This is especially fun for kids that are artistic.
Subjects:
Grades:
8th - 10th
Types:
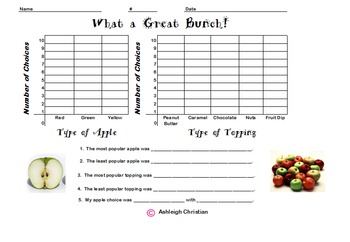
Third Grade Graphs with Tally Chart
This product is a collection of graphs to teach children how to take a poll and graph the information. There are also comprehension questions. Graphs about age, M & M's, favorite pets, apples and favorite cookies. Enjoy!
Subjects:
Grades:
3rd
Types:
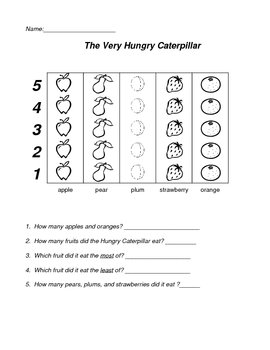
The Very Hungry Caterpillar Graphing Activity
After reading, "The Very Hungry Caterpillar", this can be used as a math extension. It is a graphing exercise based on the story.
Grades:
K - 2nd
Types:
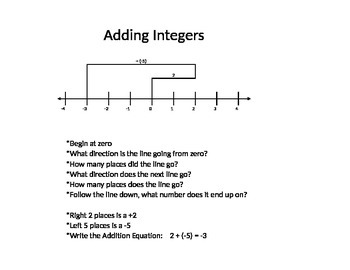
Adding Integers - Model on a Number Line
This activity provides 3 examples for the teacher to go through with the class, along with 3 extra examples for students to try individually and/or with a partner. It also includes 20 practice problems to ensure each student can not only solve an adding integers problem correctly, but they can also model it on a number line.
This file is saved in Excel, so when you print make sure you select print entire workbook. Also, since it is in Excel, feel free to change the problems as you see fit!
Subjects:
Grades:
5th - 7th
Types:

Graph Daily High and Low Temperatures - with handout
Per a few requests, I have added temperature lows as well as the temperature highs.
Type in the daily temperature on your computer with your students and it will automatically graph it for you as you type. You can pre-print the monthly graph for everyone in your class and they can follow along and graph with you. I use it with calendar math or other daily activities.
Great for explaining the scales of a graph and practicing accuracy in graphing and using rulers to connect lines. Look for tre
Subjects:
Grades:
4th - 7th
Types:
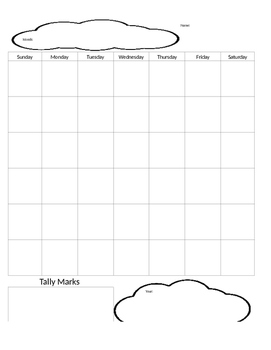
Math Meeting Calendar
Math Meeting Calendar was developed to accompany Saxon's Math Meeting. Sheet 1 Includes:* Month (left empty for practice writing and spelling)*Calendar (left empty for the student to write in the date, 6 rows for the long months)* Tally Marks (for the number of days in the month)* Year (left empty for practice in writing the year)Sheet 2 includes:* Weather Graph (for graphing practice)* Cups (to count coins and practice writing in cents)* Monthly Calendar Pattern (to draw the shape pattern for t
Subjects:
Grades:
PreK - 1st
Types:
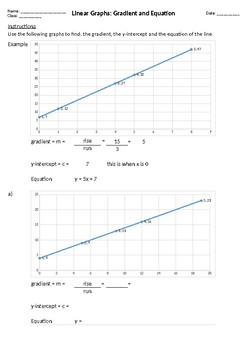
Find the Gradient and Equation from the Graph
In this worksheet students are required to use the linear graph to find:the gradient (m) using rise over runthe y-intercept (c)the equationThe worksheet is randomisable by pressing F9 on your keyboard. This will help teachers save time by not needing to prepare a new worksheet every time you wish to support students learning for this topic.Solutions are included.
Grades:
Not Grade Specific
Types:
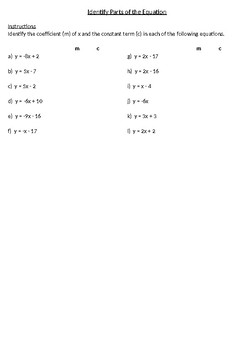
Linear Equations: Identify the Elements
Identify m and c from linear equations.The worksheet is randomisable by pressing F9 on your keyboard. This will help teachers save time by not needing to prepare a new worksheet every time you wish to support students learning for this topic.Solutions are included.
Grades:
Not Grade Specific
Types:
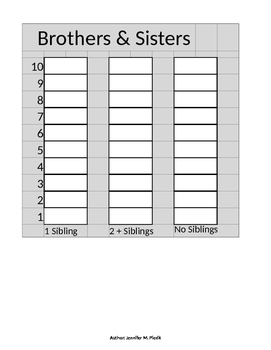
Bar Graph for Beginners (editable!)
This is a simple bar graph that will display basic data. It is editable so you can change the title & choices to suit your lesson. You can also adjust the width of the columns in order to add more choices for voting. If you fill in the data, it can even be used as an assessment. It is an excel document, so be mindful of the print area.
Subjects:
Grades:
1st - 2nd
Types:

Physics Seagull Data High School Science Part 1 of Seagull lab
This is the datasheet to graph a seagull flying for your students to graphThis is the Excell sheet to the lab Seagull Takes OffSEAGULL TAKES OFFWatch the slow-motion video of a seagull (Larus michahellis) swimming and then taking off from the water https://youtu.be/kTgN5cU580k . The camera was very far from the seagull and the rock (the photographer was using a zoom).As you can see, the photographer was moving the camera during the recording, making it difficult to analyze the seagull’s motion.
Subjects:
Grades:
10th
Types:
NGSS:
HS-PS2-2
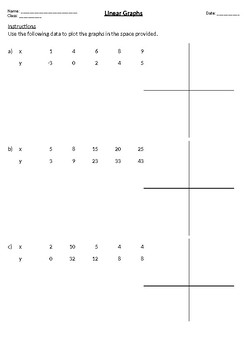
Plot the Linear Graph
Use the data points to plot the linear graph.The worksheet is randomisable by pressing F9 on your keyboard. This is so teachers can save time by not needing to create a new worksheet manually every time you want to support students with this topic.Solutions are included.
Grades:
Not Grade Specific
Types:
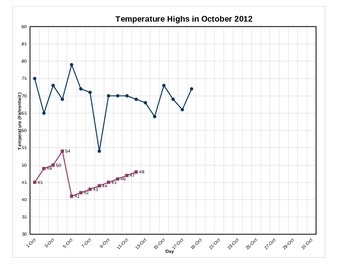
Graph Daily High and Low Temperatures - with handout
Per a few requests, I have added the capability to graph the low temperatures as well as the high temperatures.
Type in the daily temperature on your computer with your students and it will automatically graph it for you as you type. You can pre-print the monthly graph for everyone in your class and they can follow along and graph with you. I use it with calendar math or other daily activities.
Great for explaining the scales of a graph and practicing accuracy in graphing and using rulers t
Subjects:
Grades:
4th - 7th
Types:

Worksheets : Graphing Standard Form
Why limit yourself to just one worksheet. When downloaded, open the document, select "Yes", then allow Macros if prompted. If Macros are enabled, you can generate unlimited worksheets with different exercises simply by pressing Shift F9. Students need additional practice? Want all students to have different worksheets? Whatever the case may be, you can generate an unlimited number of worksheets by clicking the "New Worksheet" button. Simply Click Print and have a new worksheet, ready to go!
Grades:
7th - 12th
Types:
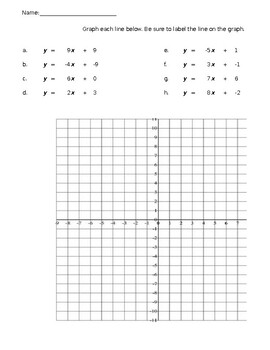
Worksheet: Graphing Slope-Intercept Form(Basic)
Why limit yourself to just one worksheet. When downloaded, open the document, select "Yes", then allow Macros. If Macros are enabled, you can generate unlimited worksheets with different exercises. Students need additional practice? Want all students to have different worksheets? Whatever the case may be, you can generate an unlimited number of worksheets by clicking the "New Worksheet" button. Simply Click Print and have a new worksheet, ready to go!
Grades:
6th - 12th
Types:
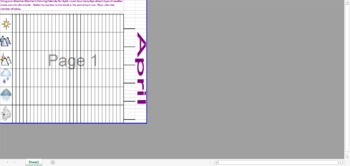
April Weather Watcher's Bar Graph
Complete this bar graph at the end of the month to total up the number of days each type of weather happened in the month. A great way to review and combine math with science skills.
Subjects:
Grades:
K - 4th
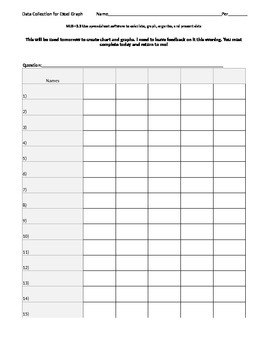
Day 1- Data Collection, Survey and Graphing (Survey Data Collection Sheet)
On day 1, students use this sheet to go around and survey others.
Grades:
4th - 9th
Types:

Function Input/Output Table
Use this form to help students organize information when teaching how to graph an equation or function. Pair this with a coordinate plane pdf from leading math worksheet sites for a simple worksheet on graphing.
I use this method before teaching slope/intercept form so the students see the connection themselves.
In excel so its easily editable for your preference.
Grades:
7th - 10th
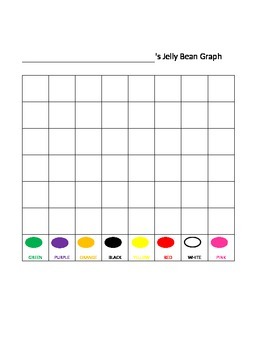
Jelly Bean Graph
Math Graphing exercise. Give each child a small cup of jelly beans, have them count them and number/shade each color on the attached graph. Ideally used in preschool or kindergarten. For a job well done, allow them to eat their jelly beans!
Subjects:
Grades:
PreK - K
Types:
Showing 1-24 of 29 results


