28 results
Graphing assessments for Microsoft Excel
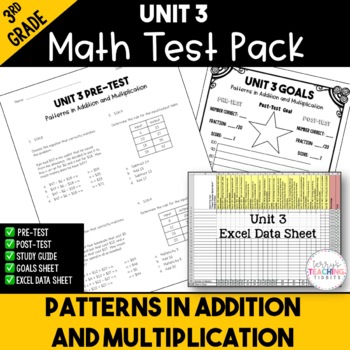
Patterns in Addition and Multiplication Printable Test Pack {3rd Grade Unit 3}
Make assessment administration incredibly easy with this printable test pack.What You Get:a printable pre-and post-test for the unit (20 questions, multiple choice)Excel data sheets to show student growth study guides to help students prepare for the post-testa student goals sheets for your class to track their growth from the beginning of the unit to the endA link to a tutorial video on how to use the Excel data sheetThis test is aligned to the Georgia Standards of Excellence Unit 3: Patterns i
Subjects:
Grades:
3rd
Types:
Also included in: 3rd Grade Printable Math Test Bundle
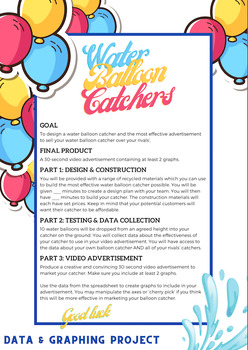
Water Balloon Catcher Project - Data and Graphing - Mathematics
Transform your maths classroom into a dynamic hub of learning with this captivating data and graphing project! Designed for upper primary/middle school students, this hands-on and inquiry-based activity ensures an immersive experience in mastering data interpretation, chart creation, and understanding the role of data and graphs in advertising.In this engaging project, students will: Explore Data: Collaborate in teams to design and construct a Water Balloon Catcher using recycled materials, each
Subjects:
Grades:
5th - 9th
Types:
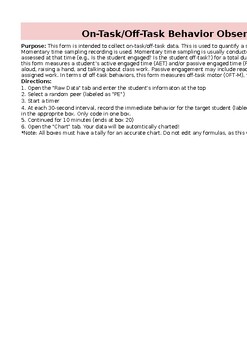
Behavior Observation Academic Engagement and Time on Task (BOSS) AUTO GRAPH
This form is intended to collect on-task/off-task data. It will AUTO graph. This is used to quantify a student's academic engagement and off-task behaviors. Momentary time sampling recording is used. This form measures a student’s active engaged time (AET) and/or passive engaged time (PET). In terms of off-task behaviors, this form measures off-task motor (OFT-M), verbal (OFT-V), and passive behaviors (OFT-P). EXCEL DOCUMENT.
Subjects:
Grades:
Not Grade Specific
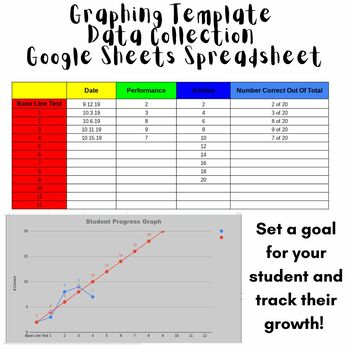
Data Collection Graph Template - Great for IEP GOALS!
Organize your data for students GOALS! Great way to TRACK and show GROWTH for progress monitoring with IEP GOALS, or really...any goals your students have! This is a spreadsheet set up for google sheets. All you need to do is enter the students information, their goal, and start tracking! Enter each time you test a student how they do, and a graph will be generated.
Subjects:
Grades:
Not Grade Specific
Types:
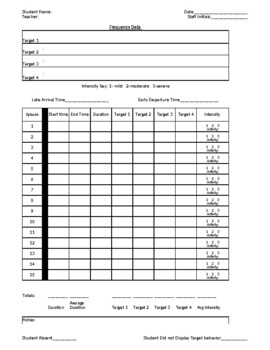
Behavior Frequency Rate Chart w/ Target, Intensity, Duration, BIP chart/Summary
Behavior Frequency Rate Chart (dates and chart cant be edited and dates changed to current year or target)--Daily Sheet-Date Entry-Intensity Chart-Duration Chart-Target Charts-BIP Evaluation printout -BIP write upSee preview for description Excel format for editing - tabs at bottom of page for easy change of view and data entry
Subjects:
Grades:
PreK - 12th
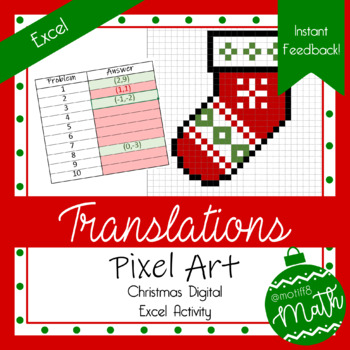
Christmas Pixel Art | Translations | Digital Geometry | Instant Feedback
Product Description: This Christmas themed, pixel art activity covers translations! Students are given three points on a graph and asked to translate one of the points according to the given translation rule.Objective: Students will be able to translate a point on a graph.Excel Student Instructions: Students will work all ten problems on the problems tab and then input their answers on the image tab. When entering their answers, students must use parentheses, a comma, and NO spaces. As students
Subjects:
Grades:
7th - 11th
Types:
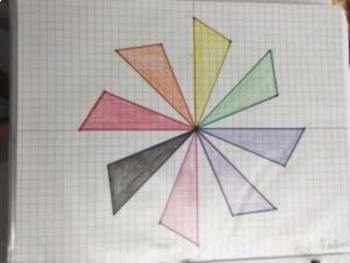
Windmill Rotations
This is a great culminating activity after Rotations are taught. Students will need to be able to do Rotations 90, 180 degrees around the origin, as well as use a protractor and ruler for 45 degrees around the origin.
Great also as a review or just a fun-Friday activity.
Subjects:
Grades:
8th - 10th
Types:
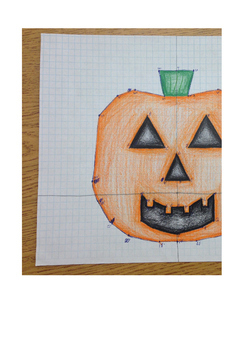
Pumpkin Transformations
This is a fun, artistic activity involving graphing on the coordinate plane, translations, and reflections. It is a great activity after translations and reflections have been taught, and best for doing in the
fall as the outcome is a pumpkin.
It could also be used as an assessment.
Materials needed: pencil, graph paper, crayons/markers/colored pencils.
Grades:
7th - 9th
Types:

Easy Math Classroom Assessment Tracker - Excel Bar Graph Formulas Pre-Loaded
This Excel file includes classroom Math proficiency trackers for schools with Pre-Tests, two or three Benchmark Assessments, and a Post-Test compared to district averages. I've also included a how-to tab and a completed example.
The file defaults to a Galileo Achievement tracker... but it is easy to edit the text if your school conducts other standardized assessments.
In just two easy steps you'll have a great visual prepared for your students:
Step 1: Enter data in the % Proficient boxes
St
Subjects:
Grades:
1st - 8th
Types:
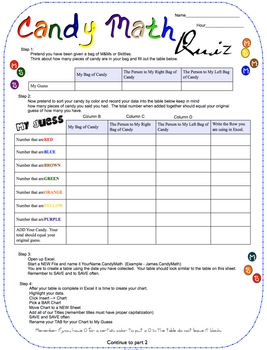
Candy Math Quiz for Grades 3-8
This quiz is a fun way to assess your students in their chart making skills in Excel along with their problem solving skills.
Part 1 of the quiz students are to pretend they have been given a bag of candy. They are to create a table then a chart with their data.
Part 2 of the quiz you give your students candy and this time they have to record the actual amount and make a table and a chart.
Part 3 of the quiz test basic formula writing.
Common Core - 3.MD.3. Draw a scaled picture graph and
Subjects:
Grades:
3rd - 9th
Types:
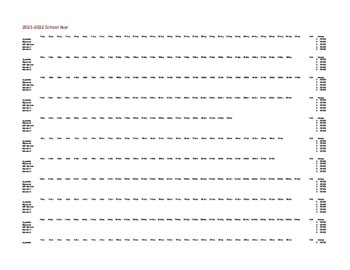
IEP Behavior Calculation
This template is a one stop shop. Insert your data and the rest is done for you. In this template you have the entire year month by month. Each month has 5 behaviors that you can calculate. Once you enter your numbers, the template will calculate the total and average, for each behavior, for that entire month. Once your month is filled out, you will go to the graph page where all your data will be graphed out for you.
Grades:
PreK - 12th, Higher Education, Adult Education
Types:

Small, Medium, Large Student Graph Paper
Three blank editable excel sheets in small, medium and large
Subjects:
Grades:
Not Grade Specific
Types:
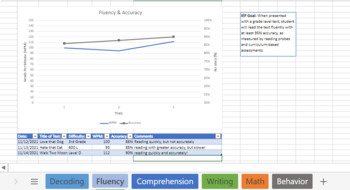
IEP Data Bundle
This bundle has it all! The IEP data sheet template is a printable resource that helps you keep a student's IEP goals and data all in one place! Just copy and paste your IEP goals or objectives in the space provided, print, and use to gather progress monitoring data. Take your data to the next level by uploading the data to an online spreadsheet. When used together, these data-driven products allow you to monitor progress on IEP goals and objectives, upload your data into a digital format an
Grades:
Not Grade Specific
Types:
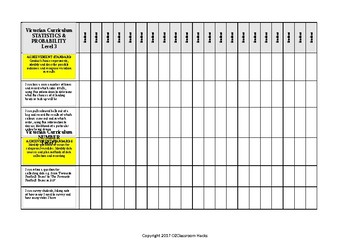
Mathematics STATISTIC PROBABILITY Checklist Level 3 Victorian Curriculum 'I Can'
Level 3 Statistics and Probability Checklist aligned with the Victorian Curriculum. Fed up with recreating new checklists - ME TOO! Hope this helps. Here is a checklist completely aligned with the Victorian Curriculum. All put simply in 'I Can' statements as YOU WOULD TEACH IT!
MAKE LIFE SIMPLE! Teaching is time consuming enough.
Subjects:
Grades:
PreK - 6th
Types:
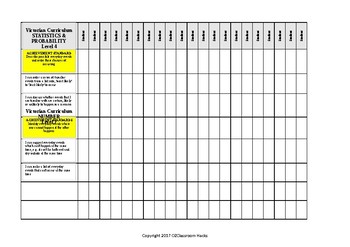
Mathematics STATISTIC PROBABILITY Checklist Level 4 Victorian Curriculum 'I Can'
Level 4 Statistics & Probability Checklist aligned with the Victorian Curriculum. Fed up with recreating new checklists - ME TOO! Here is a checklist completely aligned with the Victorian Curriculum, with 'I Can' statements breaking down each achievement standard.
These checklists can be used for assessment, reporting and for planning your curriculum so that you know you are covering everything set out in the Victorian Curriculum.
Each of these I Can statements can be used in your weekly pla
Subjects:
Grades:
2nd - 7th
Types:
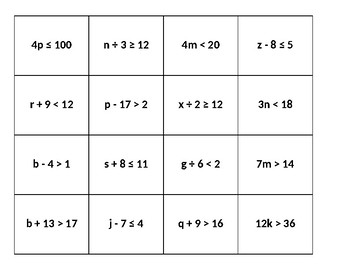
INEQUALITY SORT-N-MATCH-N-GRAPH
In this activity students will solve inequalities, match the solution to the inequality, and match the graph to its solution. This is an easily adaptable activity. Students can be given the printouts and then cut and paste and number the pages or in a current class I only used 6 inequalities, 6 solutions, and 6 graphs and hid those in Easter eggs, students had to find and egg and group up with the other 2 people that match them.
Grades:
6th - 7th
Types:
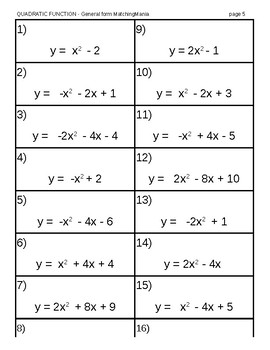
QUADRATIC FUNCTION - General Form - MatchingMania
QUADRATIC FUNCTION - General Form - MatchingMania is a fun, cooperative learning, strategy game that can be applied in multiple ways. The students are given 16 quadratic functions in general form. The students will match the functions to their vertex form. They will also select the vertex and the graph matching the given function.
Teachers also have the option of taking the vertex form and matching it to the graph, general form and vertex.
There are numerous other activities similar to th
Subjects:
Grades:
9th - 12th
Types:
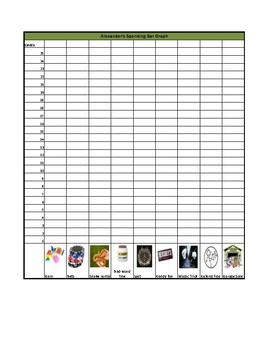
Alexander, Who Used to Be Rich Last Sunday Bar Graph
This is great companion to the story Alexander, Who Used to Be Rich Last Sunday. Students are able to develop a bar graph by shading in the number of cents spent on each item. The bar graph also includes pictures of each item to help those students who need visual representation. At the end of this activity, students will have a visual representation of all the money spent by Alexander. They will be able to use this worksheet to answer the following questions: What item did Alexander spent t
Grades:
Not Grade Specific
Types:
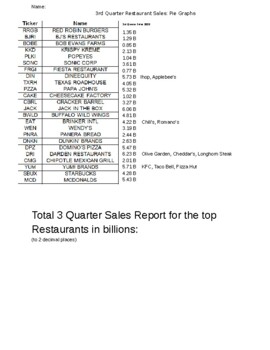
Business Statistics Graphing Project
After studying statistics in business and pie graphs, this is great culminating project. Students graph information for the 3rd quarter restaurant sales in the United States, for 2020, the middle of the pandemic. They will graph, research, and think about owning a business during uncertain times.
Subjects:
Grades:
11th - 12th
Types:
Mathematics STATISTICS and PROB Checklist Level 5 Victorian Curriculum in 'I Can
Level 5 STATISTICS and PROBABILITY Checklist aligned with the Victorian Curriculum. Fed up with recreating new checklists - ME TOO! Here is a checklist completely aligned with the Victorian Curriculum, with 'I Can' statements breaking down each achievement standard.
These checklists can be used for assessment, reporting and for planning your curriculum so that you know you are covering everything set out in the Victorian Curriculum.
Each of these I Can statements can be used in your weekly plann
Subjects:
Grades:
3rd - 7th
Types:
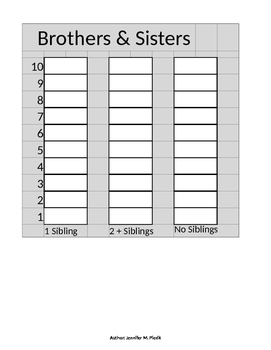
Bar Graph for Beginners (editable!)
This is a simple bar graph that will display basic data. It is editable so you can change the title & choices to suit your lesson. You can also adjust the width of the columns in order to add more choices for voting. If you fill in the data, it can even be used as an assessment. It is an excel document, so be mindful of the print area.
Subjects:
Grades:
1st - 2nd
Types:
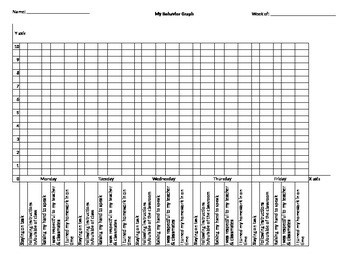
Behavior Graph
Students graph their behavior throughout the week. It is a good visual for them to see which areas they need to improve upon.
Subjects:
Grades:
1st - 4th
Types:
INEQUALITY SORT-N-MATCH-N-GRAPH
In this activity students will solve inequalities, match the solution to the inequality, and match the graph to its solution. This is an easily adaptable activity. Students can be given the printouts and then cut and paste and number the pages or in a current class I only used 6 inequalities, 6 solutions, and 6 graphs and hid those in Easter eggs, students had to find and egg and group up with the other 2 people that match them.
Grades:
6th - 7th
Types:
Worksheets : Graphing Standard Form
Why limit yourself to just one worksheet. When downloaded, open the document, select "Yes", then allow Macros if prompted. If Macros are enabled, you can generate unlimited worksheets with different exercises simply by pressing Shift F9. Students need additional practice? Want all students to have different worksheets? Whatever the case may be, you can generate an unlimited number of worksheets by clicking the "New Worksheet" button. Simply Click Print and have a new worksheet, ready to go!
Grades:
7th - 12th
Types:
Showing 1-24 of 28 results


