318 results
Graphing worksheets for Microsoft PowerPoint
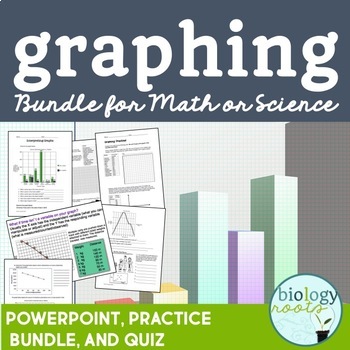
Graphing Bundle for Secondary
Complete and editable graphing bundle includes plenty of practice, editable PowerPoint notes to introduce or reinforce graphing concepts, as well as an assessment to finish it off! Suitable for grades 7 and up. Included in the package is:1. How to Interpret Graphs PowerPoint PresentationCovers line graphs, bar graphs, scatter plots and pie charts. Answers included on teacher version.Student notes included (PDF and PPT). 2. Interpreting Graphs- 3 pages of graph interpretation in which students an
Subjects:
Grades:
6th - 10th
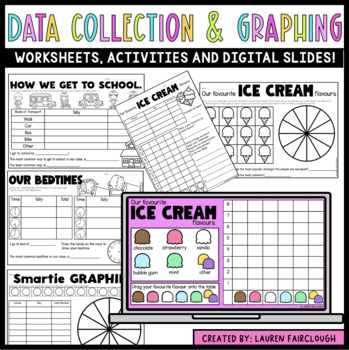
Data Collection and Graphing
Your students are going to LOVE learning all about Data Collection and Graphing with this FUN, HANDS ON pack! 10 topics are included and each includes a variety of worksheets and activities for students to collect and display data!A digital PowerPoint presentation with a number of interactive digital data collection tables and displays is also included! Please see the preview for a closer look at what is included! There are AU and US spelling versions included.
Grades:
K - 3rd
Graph Points on the Coordinate Plane (Mini Bundle) - Distance Learning
This is an awesome bundled lesson that will have your kids accurately graphing points on the coordinate plane in no time.Included in this bundled unit:PowerPointThe entertaining, interactive, and easy-to-understand 17-slide PowerPoint walks learners through:-The development of the coordinate plane-Basic graphing and coordinate plane terminology: x-axis, y-axis, ordered pair, coordinates, origin, quadrant, etc.-Plotting point demonstrations-Various plotting point practice (three slides)These embe
Subjects:
Grades:
5th - 6th
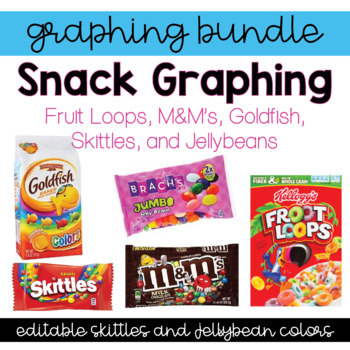
Graphing Bundle! M&M's, Skittles, Fruit Loops, Goldfish, Jellybeans!
This graphing bundle will help make teaching graphing a lot more delicious!
This bundle includes sorting pages and graphing/recording pages for the following snacks:
M&M’s, Fruit Loops, Skittles, Colorful Goldfish, and jellybeans!
I have included 5 and 6 color jellybean options that are editable. Select the page with either 5 or 6 beans and then click on the textbox that says “color” on the pages to enter the jellybean colors that your class will be graphing.
Also included is a cla
Grades:
PreK - 1st
Types:
5th Grade Geometry - Complete CCSS - (Bundled Unit)
This is an awesome bundled unit that COMPLETELY covers the entire CCSS for 5th grade geometry.Resources included in this mega-bundle: PowerPoint - Graphing Points on the Coordinate PlainThe entertaining, interactive, and easy-to-understand 17-slide PowerPoint walks learners through:-The development of the coordinate plane-Basic graphing and coordinate plane terminology: x-axis, y-axis, ordered pair, coordinates, origin, quadrant, etc.-Plotting point demonstrations-Various plotting points practic
Grades:
4th - 6th
Data Tables and Graphing Introduction and Practice
Students need practice creating data tables and graphs. Students also need to be able to interpret existing graphs. This lesson introduces students to data tables and graphs, teaches students how to create data tables from data, how to interpret tables and graphs, and offers hands-on opportunities to create data tables and graphs.
A 29-slide Power point presentation introduces data tables and graphing skills, offered in both 2003 and 2007 versions of Power point. Accompanying work pages in P
Subjects:
Grades:
5th - 8th
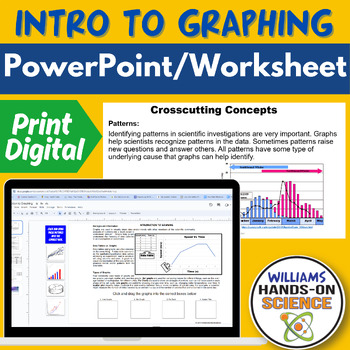
NGSS Intro to Graphing Crosscutting Concepts Science & Engineering Practices
If you are teaching your students how to understand graphs and want to hit NGSS Science and Engineering Practices and Crosscutting Concepts, this resource is a great scaffold or lecture! This resource is great as a warm up/bell ringer, lecture, homework or sub plan.This resource includes the following:-Student Handout-Key-Editable PowerPoint for lecture and/or scaffold This resource includes the following Concepts:-Interpreting Graphs-How to make a graph-Difference between data tables and graph
Subjects:
Grades:
6th - 12th
3rd and 4th Grade Multi-Step Word Problems-(200 Problems)
This packet includes over 200 word problems working on these skills:• 2 and 3 digit addition/subtraction • Carrying/Borrowing• Multi-steps• Graphing skills-Pictographs, Bar Graphs, Line Graphs, & Pie Graphs • Language-“Dozen, Half, Twice” and other key vocabulary for word problems• Other sheets that include problem solving skills• Lining up decimals using money• Place value• Multiplication/Division concepts and basic understandingThis is a PDF that includes a little over 200 multi-step word
Subjects:
Grades:
3rd - 5th
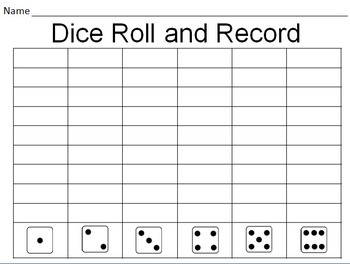
Dice Roll and Record Graphing
Use this worksheet to play a dice graphing game. Independently, with a partner, or with a small group students roll a dice and then color in the corresponding box on the graph.
Grades:
PreK - 1st
Types:
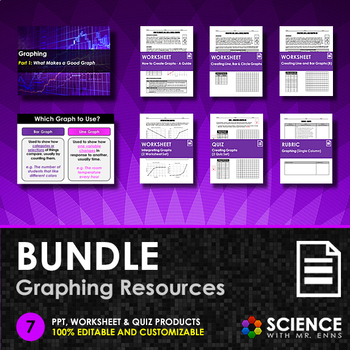
Graphing Skills or Making Graphs Unit Bundle on Line, Bar, and Circle Graphs
This bundle contains 7 graphing resources that forms a suite of products designed to teach graphing skills to middle school and early high school students.Graphing Skills Addressed:Identifying when to use a line, bar, or circle graph based on dataCreating line graphsCreating bar graphsCreating circle graphsDrawing lines of best fitInterpreting graphs (positive, negative, and no correlation)Bundle Contents:PPT - Graphing Skills (WITH SUMMARY NOTES)Worksheet - How to Create Line, Bar and Circle Gr
Subjects:
Grades:
7th - 9th
CCSS:
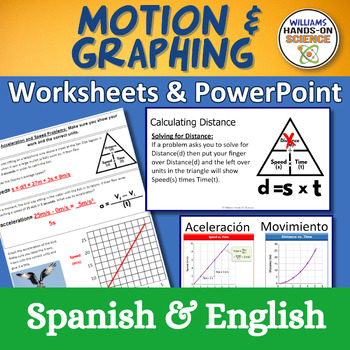
Speed Velocity Acceleration and Graphing Worksheets
Check out these hassle-free self-paced exercises on Speed, Distance, Time, Acceleration, and Graphing! This ready-to-use resource requires no preparation, offering students engaging problems to solve independently. Enhance the learning experience with an accompanying PowerPoint presentation that guides students through the worksheets effortlessly. Plus, enjoy the added convenience of Spanish versions for both the worksheets and PowerPoint. Elevate your classroom experience with this comprehensiv
Subjects:
Grades:
8th - 10th
NGSS:
MS-PS2-2
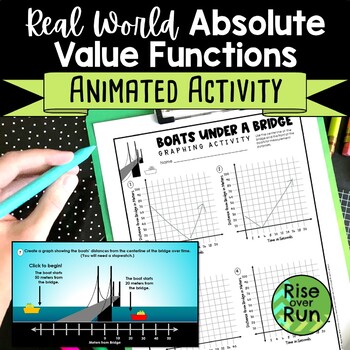
Real World Absolute Value Functions Activity
Challenge students to use absolute value graphs and equations for modeling real world situations! In the animated PowerPoint provided, students watch boats move across the screen and under a bridge. Using a stopwatch (or their phones), they time the movements. They create a graph showing each boat’s distance from the bridge. Then they determine each function and x-intercept (or when the boat passes under the bridge). 8 animations are provided. They begin simple but progress in difficulty. This
Subjects:
Grades:
9th - 12th
CCSS:
Also included in: Algebra 1 and 8th Grade Math Curriculum Bundle for Entire Year
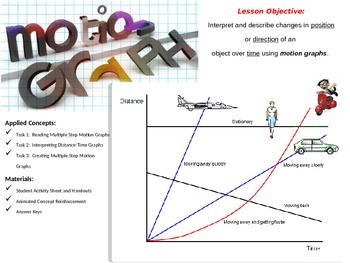
Motion Graphs
Lesson Objective:
Interpret and describe changes in position or direction of an object over time using motion graphs.
Types of Graphs Included in Lesson:
Distance/Time
Position/Time
Applied Concepts:
Task 1: Reading Multiple Step Motion Graphs
Task 2: Interpreting Distance-Time Graphs
Task 3: Creating Multiple Step Motion Graphs
Materials:
Student Activity Sheet and Handouts
Animated Concept Reinforcement
Answer Keys
*This lesson is not intended to be used as an introduction to Distanc
Subjects:
Grades:
6th - 8th
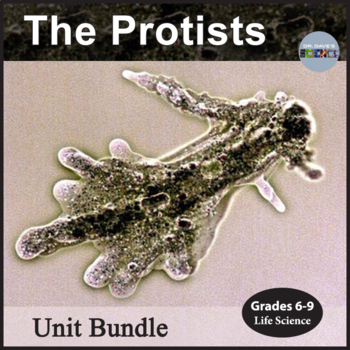
Protists Unit Bundle Protista Kingdom
This unit bundle contains both a 75-slide Protist PowerPoint as well as 19-page activity packet for the Protists. You receive a 20% discount on both resources when you purchase this bundle. Please click on the individual resources for more information. Terms of UseCopyright © Dr. Dave's Science. All rights reserved by author. This product is strictly for individual use and may not be copied or given to other teachers. Copying any part of this product and placing it on the Internet in any form (
Grades:
6th - 9th
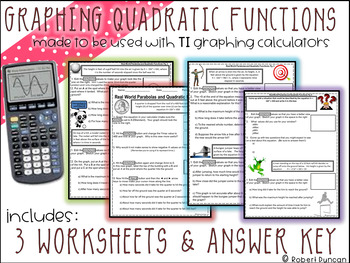
Graphing Quadratic Functions Worksheet for TI Calculators
This is sort of an exploration type activity to help students become more familiar with the window and trace functions of TI calculators. The questions are all application type problems and my goal was to create a worksheet that would let students go at their own pace without me giving direct instruction that was either too fast or too slow for them.
File includes: 4 worksheets to be used with TI Graphing Calculator and detailed answer key.
I found that letting students work with a partner
Subjects:
Grades:
8th - 12th
Types:
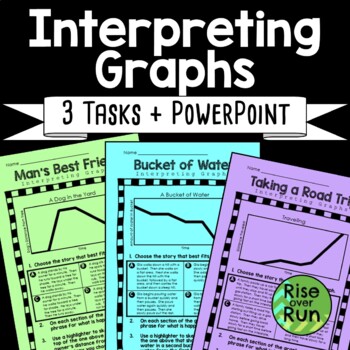
Interpreting Graphs Intro and Practice Tasks
Practice interpreting graphs with these 3 tasks and practice PowerPoint. The included PowerPoint is a great way to introduce reading graphs and relating graphs to descriptions. Students can follow along and answer on mini white boards for practice and feedback.The three tasks each give students a graph to interpret. They choose the story that matches the graph the best. Then, they describe each section of the graph with a phrase. Last, they are asked to sketch a related graph. The tasks print
Subjects:
Grades:
8th
CCSS:
Also included in: 8th Grade Math Activities & Lessons Bundle for the Whole Year
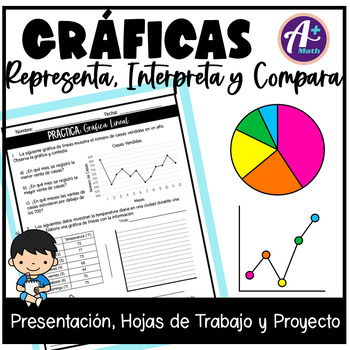
Gráficas - Estadística
Gráficas - Estadística - Analizar DatosEste recurso trabaja los siguientes temas:Gráficas: Representa, Interpreta y Compara•Recopilar y Organizar Datos •Tabla de Frecuencias•Gráfica de Barras•Gráfica Circular•Gráfica Pictórica•Gráfica Lineal•Tabla de Tallo y Hojas•Diagrama de PuntosEl recurso incluye:•Presentación en PowerPoint y PDF - 55 diapositivas con explicaciones y ejemplos•8 hojas de trabajo - Incluye la clave de respuestas•3 hojas de trabajo - Proyecto - Encuesta y analiza los res
Subjects:
Grades:
4th - 6th
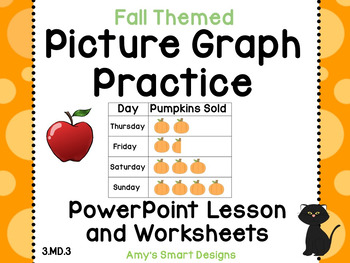
Picture Graphs: Fall Themed PowerPoint/SMARTBoard lesson and Worksheets
This fall themed bundle contains a 15 slide Picture Graph lesson in two formats: PowerPoint and SMART Board. The lesson teaches students the parts of a picture graph, reading picture graphs, constructing their own picture graphs, and giving surveys.
Also included is a packet of 11 worksheets to fit the lesson. Two pages are to be used in class with the screen slides to keep the students engaged while learning and to assess their learning. The remaining worksheets are for independent practi
Grades:
2nd - 3rd
CCSS:
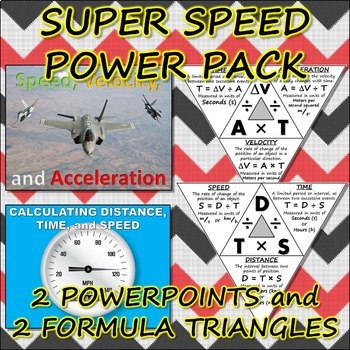
Bundle: Super Speed Power Pack
This bundle is a $35.00 value, but has been marked down by 20%! A great deal, so don't miss out!This digital package contains everything that I have personally made and incorporate into the current science curriculum about Speed, Velocity, Acceleration, Distance, and Displacement. (It mostly involves activities and worksheets involving the calculation and graphing of speed.)The Speed, Velocity, and Acceleration Power Point is a total of 27 slides, the Speed Problem PowerPoint totals at 63 slides
Grades:
6th - 9th
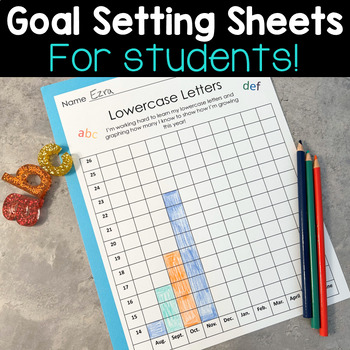
Student Goal Setting Sheets for EDITABLE Data Tracking and Graphing
Student goal setting sheets are the perfect way to hold your kids accountable for their learning! These editable tracking worksheets are perfect for monitoring your kids' growth including graphing letter sounds, uppercase letters, lowercase letters, counting to 100, words per minute, and more! Multiple cover options are also included, and the best part is everything is editable!You can completely customize these data sheets for your students so you (or they) can track goal progress!Use these EDI
Subjects:
Grades:
K - 2nd
Types:
Bundle Ecuación Lineal
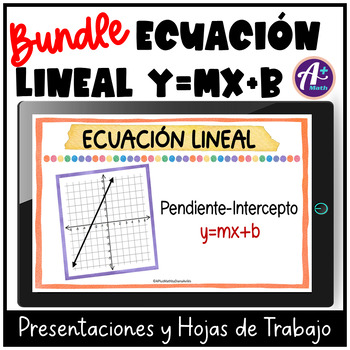
Ecuación Lineal El recurso trabaja los siguientes temas:Primera Parte•Definición de ecuación lineal•Identificar si una ecuación es lineal•Identificar si un par ordenado es solución•Explicación de la ecuación pendiente-intercepto y=mx+b•Definición de la pendiente y tipos•Definición del intercepto en y•Graficar utilizando tabla de valores•AplicacionesSegunda Parte•Definición de ecuación lineal, pendiente e intercepto en y (repaso)•Explicación de la ecuación pendiente-intercepto y=mx+b (repaso)•Hal
Grades:
7th - 9th
Line Plot Powerpoint and Worksheet
This powerpoint goes over what a line plot is and how to answer questions about it. It starts by showing a completed line plot and asks questions about it. The next line plot shows you how to use a table of data to fill out a line plot. There are also questions to go along with it. The last line plot shows you how to collect data and use it to fill out a line plot. There is a page where you can print out for the students to fill out the data and the line plot with you. There is also a page of qu
Subjects:
Grades:
2nd - 3rd
CCSS:
Coordinate Geometry and Finding Area by Decomposing Shapes
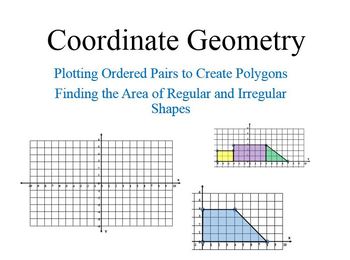
This product targets three Common Core standards. The main lesson includes 12 problems. Students plot and connect points on the coordinate axes. Then students find the area of the shapes they create. The lesson has a nice progression from simple rectangles and triangles to irregular polygons that must be decomposed into rectangles and triangles.
If you are looking for a lesson that combines many skills, then this is a great resource for you. Students plot ordered pairs in all 4 quadrants.
Subjects:
Grades:
6th - 7th
Graphing SOL Powerpoint & Note-taking Review
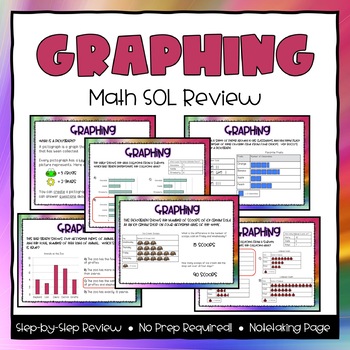
This product features a 15-page powerpoint to review: - Collecting, organizing, and representing data in bar graphs - Collecting, organizing, and representing data in pictographsIt also comes with 3 note-taking pages that go along with the powerpoint. Easy to print and use!
Subjects:
Grades:
2nd - 4th
Also included in: 3rd Grade Math SOL Powerpoint & Note-taking Review Bundle
Showing 1-24 of 318 results


