2,568 results
Statistics assessments for Microsoft OneDrive
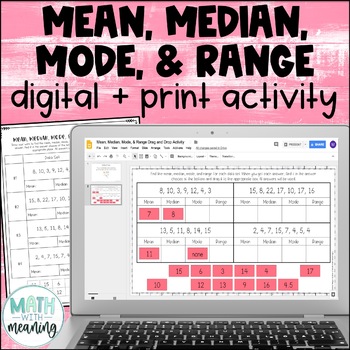
Mean, Median, Mode, & Range Digital and Print Activity for Google Drive
Looking for a fun, no-prep activity for finding mean, median, mode, and range? Students will find the mean, median, mode, and range for 4 data sets. They will then then find their answer from the answer choices at the bottom and drag it to the appropriate spot. Each data set contains 6-8 numbers. Please view the preview file to make sure that this activity is appropriate for your students.This product includes the following:A link to the digital activity on Google Slides including student direct
Subjects:
Grades:
5th - 8th
CCSS:
Also included in: Middle School Math Digital and Print Activity Bundle Volume 1
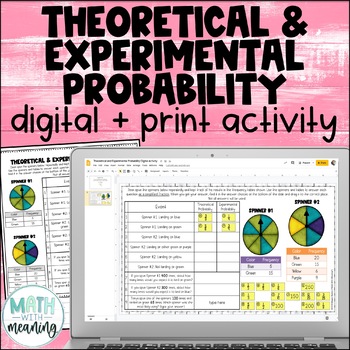
Theoretical and Experimental Probability Digital and Print Activity
Looking for an engaging, no-prep activity to practice working with theoretical and experimental probability? Students will use two sets of spinners and frequency tables to answer questions in this fun digital and print activity.This activity requires students to find the theoretical and experimental probabilities of simple events and to use theoretical probabilities to make predictions. Please view the preview file to make sure that this activity is appropriate for your students.This product inc
Subjects:
Grades:
5th - 8th
CCSS:
Also included in: Middle School Math Digital and Print Activity Bundle Volume 3
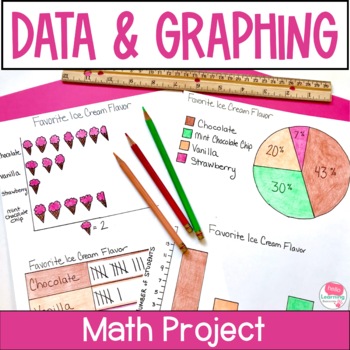
Data and Graphing Project - Real World Math Project Based Learning Activities
This data and graphing project gives your students a meaningful way to apply their data and graphing skills. Use this real world math project as an end of unit activity, enrichment activity or assessment. Easy to use and fun for students!Click the PREVIEW button above to see everything that is included in this fun math project!⭐ This resource includes:teacher information, directions and sample schedulesupply listgrading rubricstudent direction sheettwo data collection sheets (one for open ended
Subjects:
Grades:
4th - 6th
Types:
CCSS:
Grade 5 Ontario Math - Probability Curriculum - Digital Google Slides+Form
Are you planning for the NEW Grade 5 Ontario Math Curriculum? This fully editable, NO PREP Google Slide resource is what you need! This resource is for the DATA strand and covers all specific expectations for “D2. Probability”. In this resource, students will experience math through engaging real-life questions, storytelling through math, and interactive slides. For teachers who are given Nelson© Math by your board, this resource loosely follows the order of the Probability chapter (Chapter 13)
Subjects:
Grades:
4th - 6th
Also included in: Grade 5 NEW Ontario Math Curriculum Full Year Digital Slides Bundle
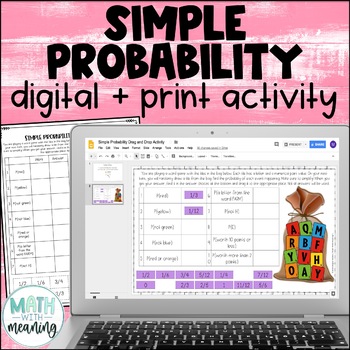
Simple Probability Digital and Print Drag and Drop Activity for Google
Looking for an engaging, no-prep activity to practice finding the probability of simple events? Students will use the included image to find the probability of 10 simple events. They will then find their answer from the answer choices at the bottom and drag it to the appropriate spot. Please view the preview file to make sure that this activity is appropriate for your students.This product includes the following:A link to the digital activity on Google Slides including student directionsA PowerP
Subjects:
Grades:
5th - 8th
CCSS:
Also included in: Middle School Math Digital and Print Activity Bundle Volume 1
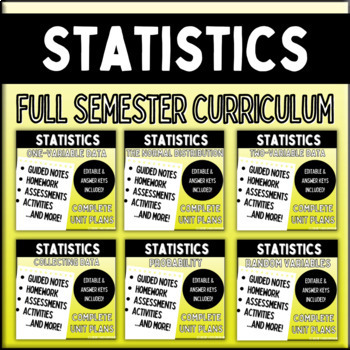
Statistics: FULL CURRICULUM BUNDLE
Statistics: Full Curriculum This is the FULL CURRICULUM bundle for my regular-level, Statistics course. If you are looking for my full curriculum for AP Statistics, follow the link here. This full curriculum is six units long and lasts 1 semester, approximately 90 school days. The following units are included in this bundle: Unit 1 – One-Variable DataUnit 2 – The Normal DistributionUnit 3 – Two-Variable DataUnit 4 – Collecting DataUnit 5 – ProbabilityUnit 6 – Random Variables Each unit contains
Subjects:
Grades:
11th - 12th
Types:
CCSS:
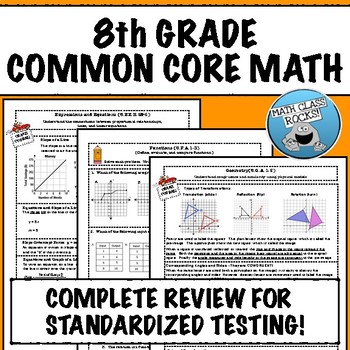
8TH GRADE MATH COMMON CORE REVIEW
If you need to prepare your students for a standardized test based on the Common Core, this “crash course” is exactly what you need! Organized by standard and easy to use, just print and let the reviewing begin! What's Included?This download consists of 10 “crash course” reviews with explanations and examples. Every "crash course" is followed by a practice assessment comprised of items aligned with standardized state tests. The Number SystemKnow that there are numbers that are not rational, a
Subjects:
Grades:
7th - 9th
Types:
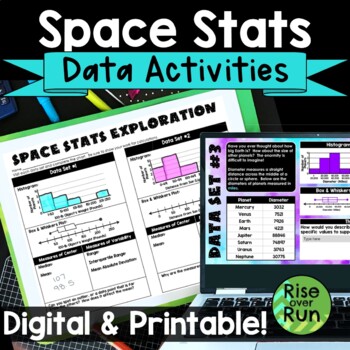
Box and Whiskers Plots and Histograms Activity with Real World Space Statistics
Use statistics for a real world application with this engaging activity about space stats! Students use real data to create histograms, box and whiskers plots, as well as calculate median, mean, range, interquartile range, and mean absolute deviation. This lesson works great for a space room transformation if you choose! Components are included in printable versions for in-person learning and Google Slides + Microsoft PowerPoint for online learning.Here’s what is included:Intro Presentation (Po
Subjects:
Grades:
6th - 9th
Types:
Also included in: Algebra 1 and 8th Grade Math Curriculum Bundle for Entire Year
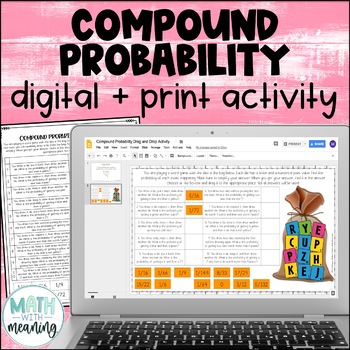
Compound Probability Digital and Print Activity for Google Drive and OneDrive
Looking for an engaging, no-prep activity to practice finding the probability of compound events? Students will use the included image to find the probability of 10 compound events, including both independent and dependent events. They will then find their answer from the answer choices at the bottom and drag it to the appropriate spot. Please view the preview file to make sure that this activity is appropriate for your students.This product includes the following:A link to the digital activity
Subjects:
Grades:
6th - 9th
CCSS:
Also included in: Middle School Math Digital and Print Activity Bundle Volume 1
Year 1 Australian Curriculum Maths Assessment BUNDLE OF ALL STRANDS
This pack contains maths assessment pages directly linking each of the content descriptions and the achievement standard of the Year 1 Australian Curriculum for Mathematics.
There are 2 assessment pages for each content description with matching standard statements for;
Number and Algebra Strand
Measurement and Geometry Strand
Statistics and Probability Strand
The assessments are designed to be used before and after teaching a unit covering this content.
Answer pages are included for ease of
Subjects:
Grades:
1st - 2nd
Types:
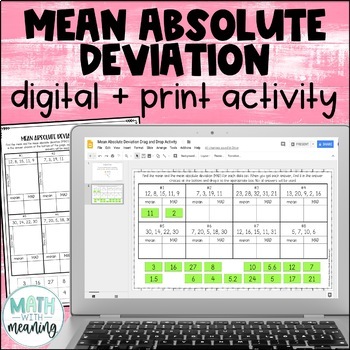
Mean Absolute Deviation MAD Digital and Print Activity for Google Drive
Looking for an engaging, no-prep activity to practice finding the MAD? Students will find the mean and mean absolute deviation for 8 data sets. They will then then find their answer from the answer choices at the bottom and drag it to the appropriate spot. Each data set contains 4-5 numbers. The mean of each data set is a whole number. Please view the preview file to make sure that these types of problems are appropriate for your students.This product includes the following:A link to the activit
Subjects:
Grades:
6th - 9th
CCSS:
Also included in: Middle School Math Digital and Print Activity Bundle Volume 2
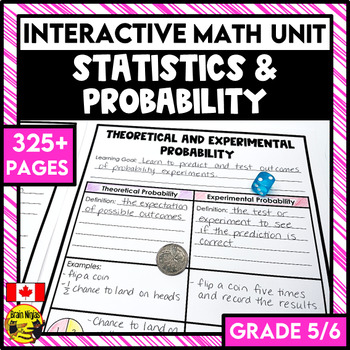
Statistics Graphing and Probability Interactive Math Unit | Grade 5 and Grade 6
Stop searching for your statistics and probability lessons. Everything you need to teach, practice, and assess double bar graphs, line graphs, stem and leaf plots, and probability is included in this print-and-use unit. Your planning for your graphing and probability unit is already done for you!This unit is part of the Full Year Interactive Math Unit Bundle for Grade 5/6. It comes with a bonus sequencing guide to help plan your whole year.This all-inclusive resource includes:instructions for ho
Subjects:
Grades:
5th - 6th
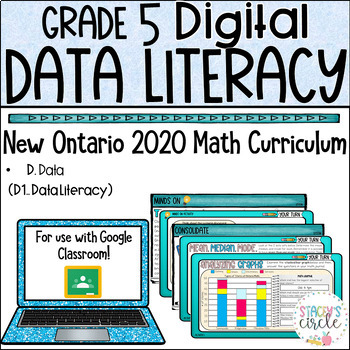
Grade 5 NEW Ontario Math Data Literacy Unit Digital Slides
This resource includes a comprehensive and engaging Grade 5 Ontario Math Data Literacy Unit including 3-part lessons, skill practice, self-grading assessment, and social emotional learning. This unit covers EVERY SPECIFIC Expectation from the 2020 Ontario D1. Data Literacy Strand. WHY BUY THIS PRODUCT OVER OTHERS?My vision for teaching math is always "Don't just tell the story, let the students experience the story first hand. HOW?Students will be walked through curriculum concepts step-by-step
Subjects:
Grades:
4th - 6th
Types:
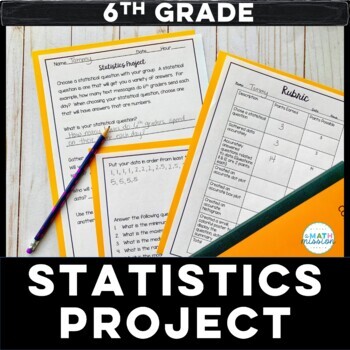
Math Statistics Project Based Learning Dot Plot Box Plot Histogram
Set your students loose to practice their statistics skills! This project is great for a culminating assessment. This project is centered around students coming up with a statistical question, and gathering data on that question. Students answer statistical questions, and create a dot plot, box and whisker plot and histogram based on the data collected. A summary of their findings is then created to display for others to see. A rubric is included for grading purposes. This project actively
Subjects:
Grades:
5th - 7th
Types:
Year 2 Australian Curriculum Maths Assessment BUNDLE OF ALL STRANDS
This pack contains maths assessment pages directly linking each of the content descriptions and the achievement standard of the Year 2 Australian Curriculum for Mathematics.
There are 2 assessment pages for each content description with matching standard statements for;
Number and Algebra Strand
Measurement and Geometry Strand
Statistics and Probability Strand
The assessments are designed to be used before and after teaching a unit covering this content.
Answer pages are included for ease of
Subjects:
Grades:
1st - 3rd
Types:
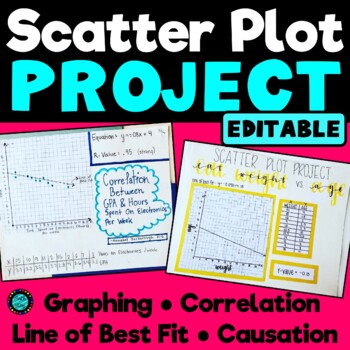
Scatter Plot Statistics Project Correlation Causation Trend Line EDITABLE
A great project to assess students' mastery of scatter plots and bivariant data, correlation coefficient, association, line of best fit, the equation of the line of best fit, and causation. Students are asked to research or collect their own data on the topic of their choice (for example: find the current age and yearly salaries of 10 famous actors, find the height and shoe sizes of 10 different students, or measure the arm span and height of 10 different people). They will display and include
Subjects:
Grades:
7th - 10th
Types:
Goldie’s Assessment Bundle for AP® Statistics
AP® Statistics Assessments - All Unit BundleNote: If you have purchased individual Unit Plans or AP® Statistics Full Curriculum, you already have these resources. You do NOT need to purchase this.Welcome! This is a bundle for all of my assessments for all Units of AP Statistics. All of the resources are 100% editable, to modify to fit your classroom needs. The zip folder includes the Word document, which you have permission to edit completely. The PDF version and answer keys are included for you
Subjects:
Grades:
10th - 12th
Types:
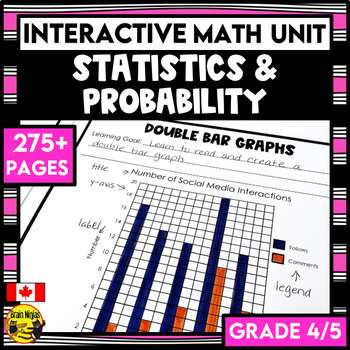
Statistics Graphing and Probability Interactive Math Unit | Grade 4/5
Stop searching for your statistics and graphing lessons. Everything you need to teach, practice, and assess bar graphs, pictographs, double graphs, stem and leaf plots and probability is included in this print-and-use unit. Your planning for your graphing unit is already done for you!This unit is part of the Full Year Interactive Math Unit Bundle for Grade 4/5. It comes with a bonus sequencing guide to help plan your whole year.This convenient resource includes:instructions for how to set up, as
Subjects:
Grades:
3rd - 5th
Analyzing Plots, Graphs, and Tables using Measures of Central Tendency
This product provides students the opportunity to analyze data presented in different ways. By making calculations and analyzing data, students make conjectures and justify them using mathematical reasoning and evidence!What is included?This product contains 8 student work pages. Each work page contains a set of data displayed graphically with accompanying questions. The data displays included are 2 dot plots, 2 bar graphs, 2 frequency tables, and 2 stem-and-leaf plots. Students are required
Subjects:
Grades:
5th - 11th
Types:
Math Task Card Activities 6th Grade Math Centers, Fractions, Decimals, Ratios
This 6th grade math task card bundle of Footloose task cards is a great way to get students moving while reviewing! Students solve each of the 30 problems in each task card set and record their answers in the corresponding boxes on their Footloose grids.This bundle of easy-prep task cards includes:16 resources, with 17 sets of task cards (Factors and GCF has 2 sets of 30)510 task cards total (30 in each set)16 pages of extra practice and problem solving (these are listed with the topics below)Ea
Subjects:
Grades:
6th
Types:
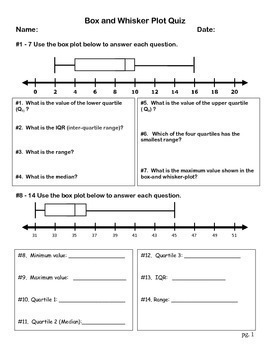
Box and Whisker Plot Quiz (Paper Format & Google Form)
PDF Copy & Google Form This 25 question quiz assess student's understanding of box and whisker plots. Questions are asked about median, IQR, range, lower extreme, upper extreme, and more. Students are also tasked with finding the median of several data sets as well as determining the five number summary of a data set. Check out the preview!
Subjects:
Grades:
6th - 8th
Types:
Grade 6 Ontario Math Probability Unit Digital Slides
Are you looking for an engaging and relatable way to teach your students concepts from the entire Grade 6 Ontario Math Probability strand? Your search ends here. WHY BUY THIS PRODUCT OVER OTHERS?My vision for teaching math is always "Don't just tell the story, let the students experience the story first hand. HOW?Students will be walked through curriculum concepts step-by-step in easy-to-understand language using identifiable and relatable problemsRather than mostly instructional slides, this pr
Subjects:
Grades:
5th - 7th
Types:
Also included in: Grade 6 Ontario Math Curriculum FULL YEAR Digital Slides Platinum Bundle
Grade 5 Probability 2020 Ontario Math Digital Googles Slides : D . Data
This resource includes a comprehensive Grade 5 Ontario Math Probability curriculum unit including lessons, activities, assessment and social emotional learning skills.This unit covers EVERY SPECIFIC Expectation from the 2020 Ontario D2. Probability (D. Data) strand. WHY BUY THIS PRODUCT OVER OTHERS?My vision for teaching math is always "Don't just tell the story, let the students become part of the story".Students will be walked through curriculum concepts step-by-step in easy-to-understand lang
Subjects:
Grades:
4th - 6th
Types:
Statistics Project
This is a survey project that is aligned to the 6th and 7th Grade Common Core (6.SP.1 to 6.SP.5 and 7.SP.1 to 7.SP.4). Students survey a random sample and then calculate the mean, median, range, and mode of the data. They also must create different data displays such as histograms and box and whisker plots. This project is an all encompassing activity that gets students thinking about statistics and loving math! They prove their understanding of the topics by asking questions they are interested
Grades:
6th - 7th
Types:
Showing 1-24 of 2,568 results


