132 results
Statistics flash cards for Microsoft OneDrive
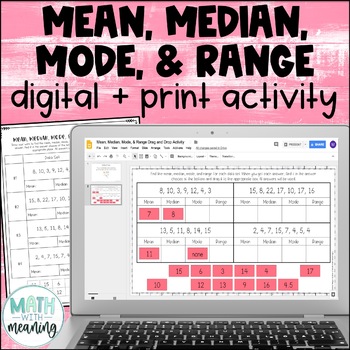
Mean, Median, Mode, & Range Digital and Print Activity for Google Drive
Looking for a fun, no-prep activity for finding mean, median, mode, and range? Students will find the mean, median, mode, and range for 4 data sets. They will then then find their answer from the answer choices at the bottom and drag it to the appropriate spot. Each data set contains 6-8 numbers. Please view the preview file to make sure that this activity is appropriate for your students.This product includes the following:A link to the digital activity on Google Slides including student direct
Subjects:
Grades:
5th - 8th
CCSS:
Also included in: Middle School Math Digital and Print Activity Bundle Volume 1
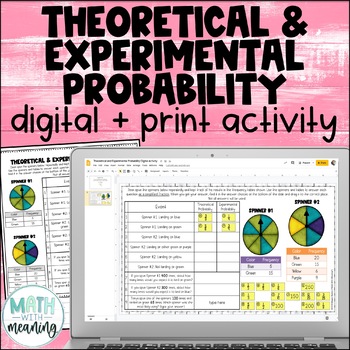
Theoretical and Experimental Probability Digital and Print Activity
Looking for an engaging, no-prep activity to practice working with theoretical and experimental probability? Students will use two sets of spinners and frequency tables to answer questions in this fun digital and print activity.This activity requires students to find the theoretical and experimental probabilities of simple events and to use theoretical probabilities to make predictions. Please view the preview file to make sure that this activity is appropriate for your students.This product inc
Subjects:
Grades:
5th - 8th
CCSS:
Also included in: Middle School Math Digital and Print Activity Bundle Volume 3
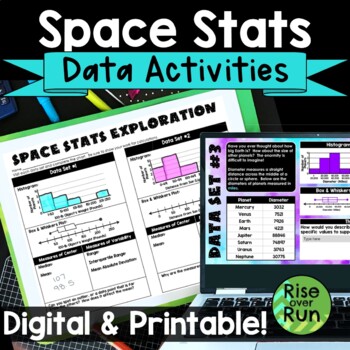
Box and Whiskers Plots and Histograms Activity with Real World Space Statistics
Use statistics for a real world application with this engaging activity about space stats! Students use real data to create histograms, box and whiskers plots, as well as calculate median, mean, range, interquartile range, and mean absolute deviation. This lesson works great for a space room transformation if you choose! Components are included in printable versions for in-person learning and Google Slides + Microsoft PowerPoint for online learning.Here’s what is included:Intro Presentation (Po
Subjects:
Grades:
6th - 9th
Types:
Also included in: Algebra 1 and 8th Grade Math Curriculum Bundle for Entire Year
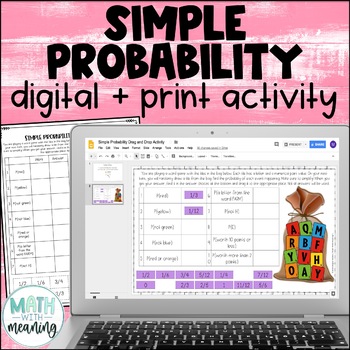
Simple Probability Digital and Print Drag and Drop Activity for Google
Looking for an engaging, no-prep activity to practice finding the probability of simple events? Students will use the included image to find the probability of 10 simple events. They will then find their answer from the answer choices at the bottom and drag it to the appropriate spot. Please view the preview file to make sure that this activity is appropriate for your students.This product includes the following:A link to the digital activity on Google Slides including student directionsA PowerP
Subjects:
Grades:
5th - 8th
CCSS:
Also included in: Middle School Math Digital and Print Activity Bundle Volume 1
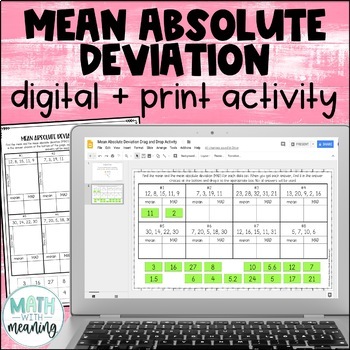
Mean Absolute Deviation MAD Digital and Print Activity for Google Drive
Looking for an engaging, no-prep activity to practice finding the MAD? Students will find the mean and mean absolute deviation for 8 data sets. They will then then find their answer from the answer choices at the bottom and drag it to the appropriate spot. Each data set contains 4-5 numbers. The mean of each data set is a whole number. Please view the preview file to make sure that these types of problems are appropriate for your students.This product includes the following:A link to the activit
Subjects:
Grades:
6th - 9th
CCSS:
Also included in: Middle School Math Digital and Print Activity Bundle Volume 2
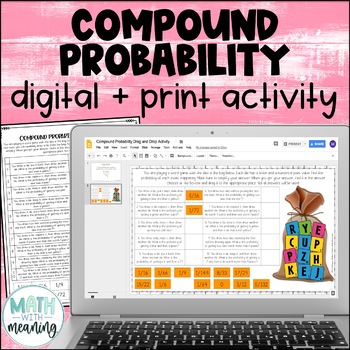
Compound Probability Digital and Print Activity for Google Drive and OneDrive
Looking for an engaging, no-prep activity to practice finding the probability of compound events? Students will use the included image to find the probability of 10 compound events, including both independent and dependent events. They will then find their answer from the answer choices at the bottom and drag it to the appropriate spot. Please view the preview file to make sure that this activity is appropriate for your students.This product includes the following:A link to the digital activity
Subjects:
Grades:
6th - 9th
CCSS:
Also included in: Middle School Math Digital and Print Activity Bundle Volume 1
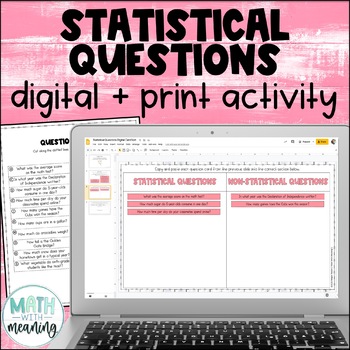
Statistical Questions Digital and Print Card Sort for Google Drive and OneDrive
Looking for an engaging, no-prep activity to practice identifying statistical and non-statistical questions? Students will read 20 questions and determine if they are statistical or non-statistical questions in this fun digital and print card sort activity. They will also choose a topic and write one one of each type of question of their own about that topic.Please view the preview file to make sure that this activity is appropriate for your students.This product includes the following:A link to
Subjects:
Grades:
5th - 8th
CCSS:
Also included in: Middle School Math Digital and Print Activity Bundle Volume 3
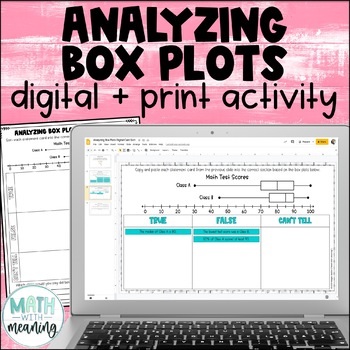
Box and Whisker Plot Digital and Print Card Sort - Reading and Analyzing
Looking for an engaging, no-prep activity to practice reading and analyzing box plots? Students will look at a double box plot and determine if statements about it are true, false, or if they can't tell from the information given in this fun digital and print activity.This activity includes statements about the minimum, maximum, median, quartile 1 (Q1), quartile 3 (Q3), interquartile range (IQR), and range of the box plots, along with statements about the percentages represented by a particular
Subjects:
Grades:
6th - 9th
Also included in: Middle School Math Digital and Print Activity Bundle Volume 3
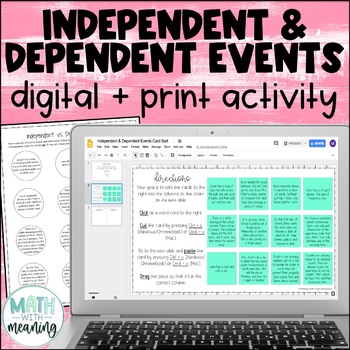
Independent and Dependent Events Digital Print Card Sort - Compound Probability
Looking for an engaging, no-prep activity to practice identifying independent and dependent events? Students will read 12 sets of compound events and determine if they are independent or dependent events. Many examples of real-world events are included. This is a great activity for students learning compound probability who struggle with differentiating between independent and dependent events. Also included is a printable graphic organizer that is perfectly sized for interactive notebooks. Plea
Subjects:
Grades:
6th - 9th
CCSS:
Also included in: Middle School Math Digital and Print Activity Bundle Volume 2
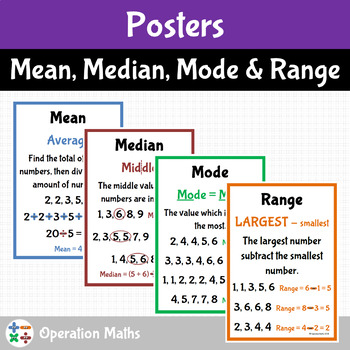
Mean, Median, Mode and Range Posters
These bright and colourful posters can be used for display or laminated and used during lessons.The pack includes the following with an explanation and at least one example of how to work them out.· Mean poster· Median poster· Mode poster· Range poster· All four posters on one pageThe A to Z Booklet for Mean, Median, Mode and Range can be found here.
Subjects:
Grades:
5th - 8th
Types:
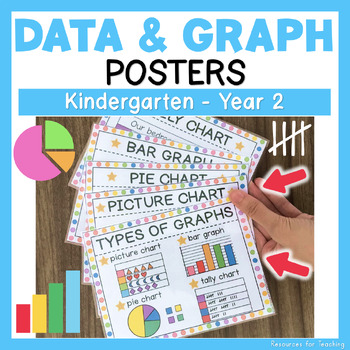
Types of Graphs Maths Posters for Kindergarten, Year 1 and 2 Students
An excellent learning tool for Kindergarten, Year 1 and 2 students. Aligned with the Australian Curriculum (ACMSP263, ACMSP048, ACMSP049 & ACMSP050).These colourful posters can also be used as display cards for children learning how to collect, interpret and organise data in math lessons. All these posters are fantastic during a class discussion to differentiate between different graphs by looking at the physical characteristics and then interpreting the information.Posters include:1) Types
Subjects:
Grades:
K - 2nd
Types:
Also included in: DATA AND GRAPHING BUNDLE: YEAR 1 AND 2 MATHS
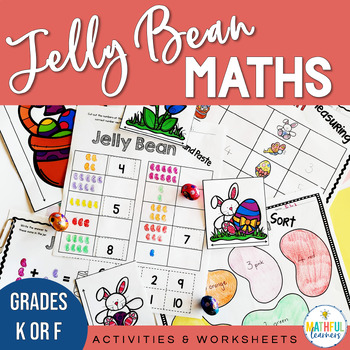
Jelly Bean Math - Easter Themed No Prep Math Activities & Worksheets
This Jelly Bean Math pack of no prep Math activities and worksheets is fun, engaging and your students will love it! This 25 page pack will help you cover many areas of the Math Curriculum in just ONE week. The Easter themed Math activities and worksheets are perfect for that week before Easter, or anytime of year. It contains activities relating to numbers, counting, addition and subtraction, shape, data collection and measurement all perfect for Kindergarten/Foundation students.A week of your
Subjects:
Grades:
PreK - 1st
Types:
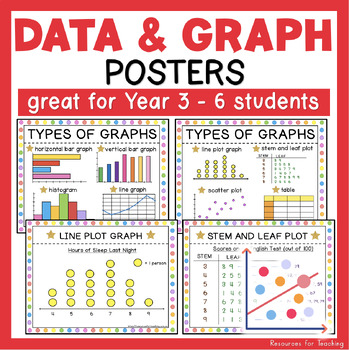
Types of Graphs Maths Posters for Year 3, 4, 5 & 6 Students
These vivid types of graphs maths posters are perfect for Year 3, 4, 5 & 6 students learning to collect, interpret and organise data in math lessons. All these posters are fantastic for using during a class discussion to differentiate between different graphs by looking at the physical characteristics and then interpreting the information. The Posters Include:1) Types of Graphs: horizontal bar graph, vertical bar graph, histogram, line graph, line plot graph, stem and leaf plot, scatter plot
Subjects:
Grades:
3rd - 6th
Types:
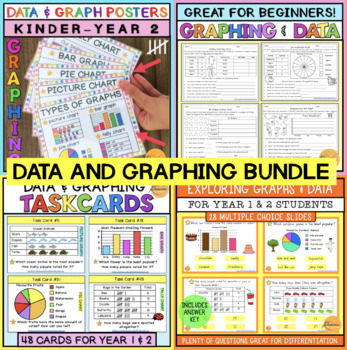
DATA AND GRAPHING BUNDLE: YEAR 1 AND 2 MATHS
This data and graphing BUNDLE is a massive time-saver for Year 1 & 2 teachers! Includes plenty of materials that are wonderful for teaching students how to interpret, analyse and collect data. This download comes with informational slides, multiple choice questions, task cards, worksheets and posters that are engaging and helpful for students during maths lessons! Includes plenty of different tasks that are wonderful for differentiation in the classroom.What's Included?1. Exploring Graphs an
Subjects:
Grades:
1st - 2nd
Types:
Statistics for Business and Economics 14th Edition By James, George TEST BANK
TEST BANK for Statistics for Business and Economics 14th Edition James T. McClave; P. George Benson; Terry T SincichTABLE OF CONTENTSCHAPTER 1. Statistics, Data, and Statistical Thinking CHAPTER 2. Methods for Describing Sets of DataCHAPTER 3. ProbabilityCHAPTER 4. Random Variables and Probability DistributionsCHAPTER 5. Sampling Distributions CHAPTER 6. Inferences Based on a Single Sample: Estimation with Confidence IntervalsCHAPTER 7. Inferences Based on a Single Sample: Tests of HypothesesCHA
Subjects:
Grades:
Higher Education, Adult Education, Staff
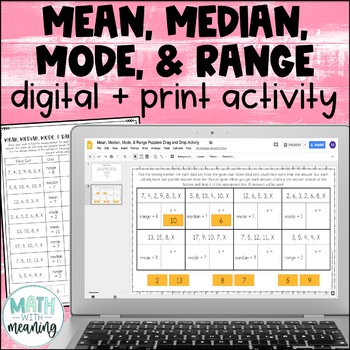
Mean, Median, Mode, & Range Missing Numbers Digital and Print Activity
Looking for a fun, no-prep activity for calculating mean, median, mode, and range? Students will find the missing number in a data set given either the mean, median, mode, or range. They will then then find their answer from the answer choices at the bottom and drag it to the appropriate spot. Each data set contains 4-7 numbers. Some data sets have more than one possible answer, but only one possible answer choice will be given. Please view the preview file to make sure that this activity is app
Subjects:
Grades:
5th - 8th
CCSS:
Also included in: Middle School Math Digital and Print Activity Bundle Volume 1
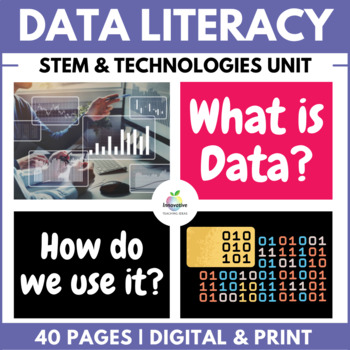
Data Literacy in STEM & Digital Technologies | Numerical, Categorical & Digital
Enhance your student's understanding of DATA LITERACY and DIGITAL LITERACY What is Data? Why it's important? How do numerical, categorical, and digital data fit within STEM and DIGITAL TECHNOLOGIES?Well, look no further... This bundle contains everything you need to teach the essentials of DATA LITERACY with absolutely NO PREP REQUIRED.CoveringNumerical DataCategorical DataDigital DataData collectionData analysisData Sorting and FilteringData visualization and representationBinary, QR and more
Grades:
3rd - 10th, Adult Education, Staff
Types:
Mean Absolute Deviation (MAD) Foldable
This product is a foldable introducing the concept of Mean Absolute Deviation (MAD). The download includes an answer key and a blank copy. Simply print front to back and enjoy!
Thank you for your interest!
-Middle Math Madness
Subjects:
Grades:
6th - 8th
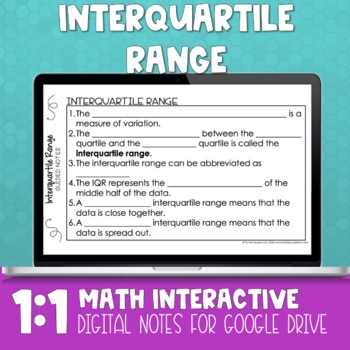
Interquartile Range Digital Math Notes
Interquartile Range (IQR) 1:1 Interactive Math NotebookAre you looking for a way to engage your math students in a 1:1 device environment? Check out my line of 1:1 Interactive Math Notebooks! Included in this product: -Interquartile Range Guided Notes-Interquartile Range Practice Page-Interquartile Range Frayer Models for Vocabulary Practice-2 different warm-ups -2 different exit slips -Answer Keys*Please note that the download includes a link to the product and a tutorial for teacher use. This
Subjects:
Grades:
5th - 8th
Types:
CCSS:
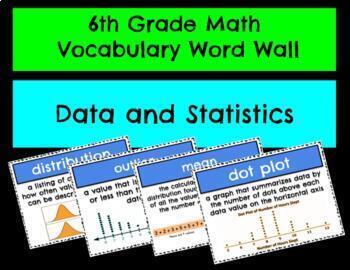
6th Grade Math Vocabulary Word Wall -- Data and Statistics
All of the math vocabulary words you need to teach data and statistics for 6th grade. The set includes both full color versions of the vocabulary posters which can be used on a word wall, distributed via Google Classroom, or as part of a student interactive notebook.
Subjects:
Grades:
5th - 7th
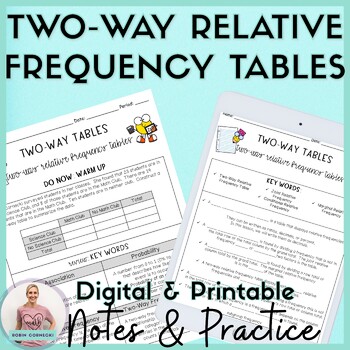
Two Way Relative Frequency Tables Guided Notes Practice HW 8th Grade Math
Two-Way Relative Frequency Tables Guided Notes is everything that you need to teach your middle school math students Constructing and Interpreting Two-Way Relative Frequency Tables. Students will also identify Joint Relative Frequency, Conditional Relative Frequency, and Marginal Relative Frequency through investigation and practice examples. These guided notes and practice worksheets are perfect for a binder or can be reduced in size to fit into an interactive notebook.✅This resource is pe
Subjects:
Grades:
7th - 9th
Types:
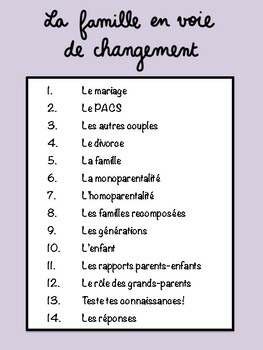
La famille- Infographie- Family Trends- AP French (intermediate to advanced)
In the resource file, you will find 12 infographic sheets on the topic of family trends for students of French (intermediate to advanced) + a test (and answers). All facts and statistics are linked to France. These can be used for flipped learning, revision material, independent study etc…The resource comes as a 15 pages booklet (including the content page) as well as 14 files for single pages, should you wish to send specific aspects to your students.Please note: The sheets are in .pdf format a
Subjects:
Grades:
9th - 12th, Higher Education, Adult Education
Types:
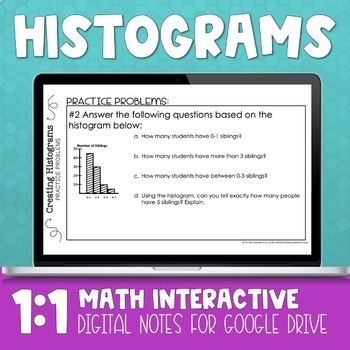
Histogram Digital Math Notes
Histogram 1:1 Interactive Math NotebookAre you looking for a way to engage your math students in a 1:1 device environment? Check out my line of 1:1 Interactive Math Notebooks! Included in this product: -Histogram Guided Notes-Histogram Practice Page-Histogram Frayer Models for Vocabulary Practice-2 different warm-ups -2 different exit slips -Answer Keys*Please note that the download includes a link to the product and a tutorial for teacher use. This product is best used in Google Drive or Micros
Subjects:
Grades:
5th - 8th
Types:
CCSS:

High School Math Mystery Challenge
There is a murder in the district and detective Simpson has been called to the murder scene. But he needs to put his Math skills to use in order to solve the clues leading to the murderer. Can he do it? Time is ticking away so he needs to work fast!
This is a murder mystery game that requires students to be grouped in teams of three or four and solve various Math problems to solve the mystery.
Topics covered include:
1. Differentiation
2. Graphs
3. Statistics & Probability
4. Algebra
5. Si
Subjects:
Grades:
11th - 12th
Types:
Showing 1-24 of 132 results


