Box and Whiskers Plots and Histograms Activity with Real World Space Statistics
- Zip
- Google Apps™
- Microsoft OneDrive

What educators are saying
Also included in
- Do you love discovery learning, collaboration, hands-on activities, and projects that help students make sense of the math they are learning? This curriculum is packed with engaging and challenging Algebra I and 8th grade math resources for the whole year. A variety of activities, inquiry learningPrice $350.00Original Price $677.94Save $327.94
- This curriculum bundle includes a variety of activities, assessments, games, group activities, projects, inquiry lessons, guided notes, and more for teaching Algebra I CCSS standards. The activities are centered on discovery learning and engaging activities with real world connections. Lessons helpPrice $225.00Original Price $445.21Save $220.21
- Looking for sixth grade math resources that are engaging, meaningful, standards-based, and help build conceptual understanding? In this big pack are 35+ resources that include hands-on learning, card sorts, games, projects, group activities, and more! These activities are rigorous and engaging. AsPrice $73.00Original Price $109.25Save $36.25
- No more boring box plot lessons! These activities are engaging and will help your students see how box plots are really useful with real world data. Grab these 5 resources, print, and be ready to go! Here are the resources included in this bundle:Box & Whiskers Real World Temperature LessonIn tPrice $9.00Original Price $15.50Save $6.50
Description
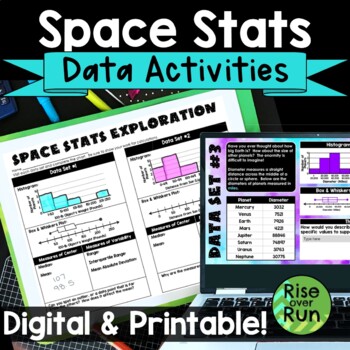
Use statistics for a real world application with this engaging activity about space stats!
Students use real data to create histograms, box and whiskers plots, as well as calculate median, mean, range, interquartile range, and mean absolute deviation. This lesson works great for a space room transformation if you choose! Components are included in printable versions for in-person learning and Google Slides + Microsoft PowerPoint for online learning.
Here’s what is included:
- Intro Presentation (PowerPoint, Google Slides): A presentation to help students understand the difference in statistical and non-statistical questions.
- Space Stats Exploration (Printable, Google Slides, PowerPoint): Students use 4 sets of data about space to complete a histogram and box & whiskers plot. Then, they calculate measures of center (mean and median) and measures of variability (range, interquartile ranges, and mean absolute deviation). Last they answer a higher order thinking question about each set of data. This part works great as math stations, group work, or for individuals.
- Pluto Extension (Printable, Google Slides, PowerPoint): An optional extension is provided where students use data to determine if Pluto should be considered a planet. This is great for early finishers or extra credit.
- Follow Up (Printable, Google Slides, PowerPoint): Perfect for an exit ticket, quiz, or homework, students are given a set of data about the planets. On their own, they complete a histogram and box & whisker plot, along with calculate measures of center (mean and median) and measures of variability (range, interquartile ranges, and mean absolute deviation).
This activity could take multiple class periods if used in entirety. Calculating mean absolute deviations for each data set will take time because decimals are involved. To save time, you could have students only calculate the MAD for one data set and/or use calculators.
This activity is based on the following 6th grade CCSS Statistics standards:
6.SP.A.1 Recognize a statistical question as one that anticipates variability in the data related to the question and accounts for it in the answers.
6.SP.A.2 Understand that a set of data collected to answer a statistical question has a distribution which can be described by its center, spread, and overall shape.
6.SP.A.3 Recognize that a measure of center for a numerical data set summarizes all of its values with a single number, while a measure of variation describes how its values vary with a single number.
Summarize and describe distributions.
6.SP.B.4 Display numerical data in plots on a number line, including dot plots, histograms, and box plots.
6.SP.B.5.c Giving quantitative measures of center (median and/or mean) and variability (interquartile range and/or mean absolute deviation), as well as describing any overall pattern and any striking deviations from the overall pattern with reference to the context in which the data were gathered.
It also works great as a review for 7th grade, 8th grade, or Algebra 1 students who may need a refresher for working with statistics!
Here's what teachers like you said about this activity:
⭐️⭐️⭐️⭐️⭐️ "This might be the best purchase I have made on TPT! This was an incredible way to use data relating to both our state math and science standards at the same time! The pages were professionally put together and the data was relevant and allowed for us to have meaningful conversations on why Box and Whiskers and other forms of data, are used. I also loved how students needed to reflect on what they learned at the end too! Thank you! I will definitely be visiting your page for future material. " - Chris L.
⭐️⭐️⭐️⭐️⭐️ "This was a really interesting and engaging activity that sparked some great discussion and kept student interests. The layout of the slides looked interesting and well-organized and was easy for students to use. Thank you for this resource! " - Nicole C.


