807 results
Statistics task cards for Microsoft OneDrive
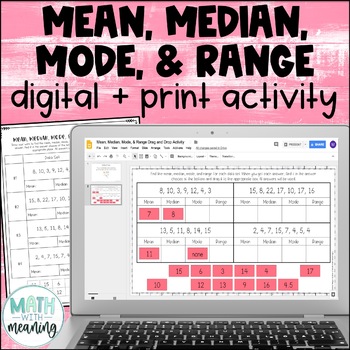
Mean, Median, Mode, & Range Digital and Print Activity for Google Drive
Looking for a fun, no-prep activity for finding mean, median, mode, and range? Students will find the mean, median, mode, and range for 4 data sets. They will then then find their answer from the answer choices at the bottom and drag it to the appropriate spot. Each data set contains 6-8 numbers. Please view the preview file to make sure that this activity is appropriate for your students.This product includes the following:A link to the digital activity on Google Slides including student direct
Subjects:
Grades:
5th - 8th
CCSS:
Also included in: Middle School Math Digital and Print Activity Bundle Volume 1
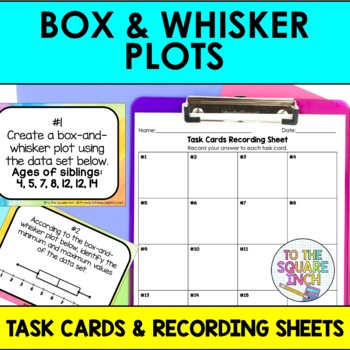
Box and Whisker Plot Task Cards Activity | Box and Whisker Math Center Practice
Boost your students' understanding of box and whisker plots with this engaging task card activity. This low-prep set includes 20 task cards that are perfect for reinforcing all concepts of area of composite shapes. With minimal prep required, your students will practice and build these skills in a fun, engaging and out-of-their seat activity perfect for supplementing any lesson. These cards can quickly be set up for a variety of different activities that will make for a more dynamic learning e
Subjects:
Grades:
5th - 8th
Types:
CCSS:
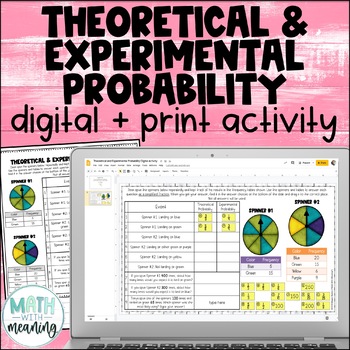
Theoretical and Experimental Probability Digital and Print Activity
Looking for an engaging, no-prep activity to practice working with theoretical and experimental probability? Students will use two sets of spinners and frequency tables to answer questions in this fun digital and print activity.This activity requires students to find the theoretical and experimental probabilities of simple events and to use theoretical probabilities to make predictions. Please view the preview file to make sure that this activity is appropriate for your students.This product inc
Subjects:
Grades:
5th - 8th
CCSS:
Also included in: Middle School Math Digital and Print Activity Bundle Volume 3
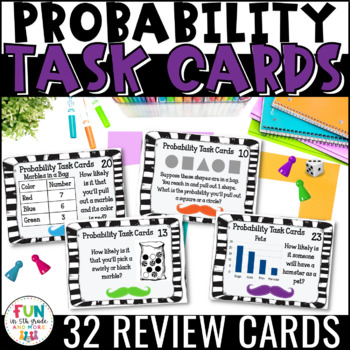
Probability Task Cards Math Review
Probability Task Cards help students practice probability in a fun way. Use these task cards for various activities or math centers to teach/review probability skills such as compound events, likelihood of an event, combinations., and MORE! Use for Scoot, small groups, centers, or whatever else you can think of!This set of 32 cards covers skills such as:**determining the probability of an event**stating whether an event is certain, impossible, least likely, most likely, or equally likely**comp
Subjects:
Grades:
3rd - 6th
Types:
Also included in: Math Task Card Bundle
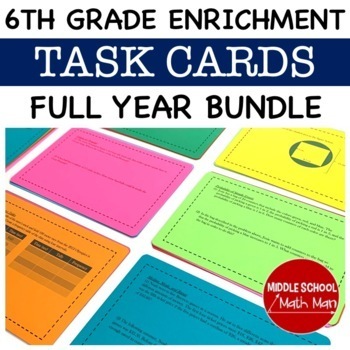
6th Grade Math Task Cards | Math Enrichment Task Card Activities Bundle
These 6th grade math task card activities include 87 different challenging task cards to use as review, enrichment, math centers, or with early finishers. The task cards are designed specifically for 6th grade math topics. Concepts include geometry, algebra, numbers and operations, statistics, and other standards listed below. All task cards include a digital Google slides and printable option.Save 40% and get the majority of my math products, including this resource, at a large discount by purc
Subjects:
Grades:
5th - 8th
Types:
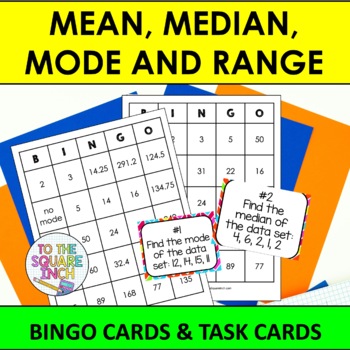
Mean, Median, Mode and Range Bingo Game | Task Cards | Whole Class Activity
Mean, Median, Mode and Range Bingo and Task CardsIncluded in this product:30 unique Range, Mean, Median and Mode bingo cards.25 Range, Mean, Median and Mode calling cards (numbered to be used as task cards for independent or small group work)2 different task cards recording sheetAnswer KeyCheck out my other BINGO games HERE Check out my other data and statistics products HERE
Subjects:
Grades:
5th - 7th
Types:
CCSS:
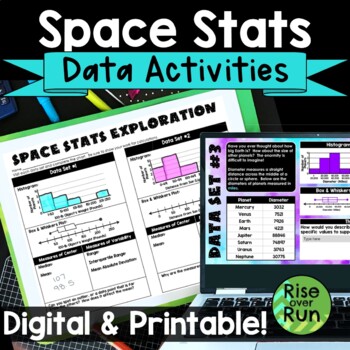
Box and Whiskers Plots and Histograms Activity with Real World Space Statistics
Use statistics for a real world application with this engaging activity about space stats! Students use real data to create histograms, box and whiskers plots, as well as calculate median, mean, range, interquartile range, and mean absolute deviation. This lesson works great for a space room transformation if you choose! Components are included in printable versions for in-person learning and Google Slides + Microsoft PowerPoint for online learning.Here’s what is included:Intro Presentation (Po
Subjects:
Grades:
6th - 9th
Types:
Also included in: Algebra 1 and 8th Grade Math Curriculum Bundle for Entire Year
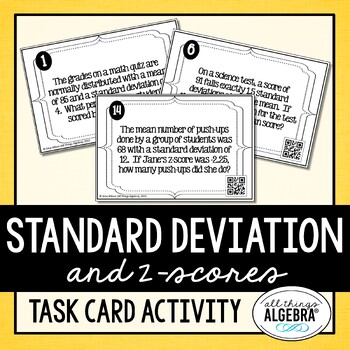
Normal Distribution, Standard Deviation, Z-Scores | Task Cards
Normal Distribution, Standard Deviation, Z-Scores Task CardsStudents will practice calculating and interpreting z-scores, normal distribution, and standard deviation in real world contexts by working through these 20 task cards. These are challenging and diverse questions that require students to read carefully. They can check their answers by scanning the QR code on each card. Connection to the internet is not required to scan the code. However, a QR scanner app is required on the device.
Subjects:
Grades:
8th - 12th
Types:
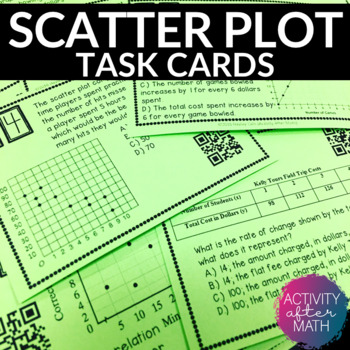
Scatter Plots and Line of Best Fit Task Cards with QR Codes
Get your students involved with practicing Interpreting Data with Scatter Plots and Line of Best Fit! Task cards include multiple choice problems and constructed response. Click here to SAVE and get this as a Task Cards BUNDLEThis resource includes:Teacher InstructionsTeacher TipsStudent Instructions24 Task cards with QR codes24 Task cards without QR codesBlank Answer Document for studentsAnswer Key for easy gradingOptions for using this resource:You can print the ones with QR codes for students
Subjects:
Grades:
8th - 9th
Types:
Also included in: 8th Grade MATH TASK CARDS BUNDLE
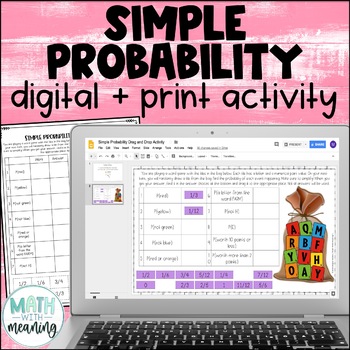
Simple Probability Digital and Print Drag and Drop Activity for Google
Looking for an engaging, no-prep activity to practice finding the probability of simple events? Students will use the included image to find the probability of 10 simple events. They will then find their answer from the answer choices at the bottom and drag it to the appropriate spot. Please view the preview file to make sure that this activity is appropriate for your students.This product includes the following:A link to the digital activity on Google Slides including student directionsA PowerP
Subjects:
Grades:
5th - 8th
CCSS:
Also included in: Middle School Math Digital and Print Activity Bundle Volume 1
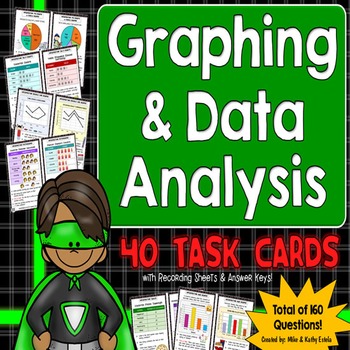
Graphing and Data Analysis Task Cards {Interpreting Graphs and Tables}
Graphing and Data Analysis Task Cards: This set of 40 task cards (with 160 questions total) is designed to help students learn or practice how to read, analyze, and interpret data presented in tables and various forms of graphs. You may use these task cards for individual work, pair/group activity, whole class discussion, or in math centers. NOTE: For a full-page version of these task cards (with exactly the same problems/questions), click this link: Graphing and Data Analysis (Poster Size Task
Subjects:
Grades:
4th - 6th
Types:
Also included in: Math Task Cards SUPER BUNDLE
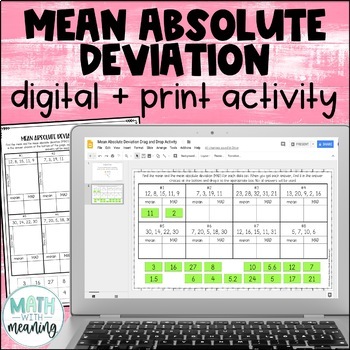
Mean Absolute Deviation MAD Digital and Print Activity for Google Drive
Looking for an engaging, no-prep activity to practice finding the MAD? Students will find the mean and mean absolute deviation for 8 data sets. They will then then find their answer from the answer choices at the bottom and drag it to the appropriate spot. Each data set contains 4-5 numbers. The mean of each data set is a whole number. Please view the preview file to make sure that these types of problems are appropriate for your students.This product includes the following:A link to the activit
Subjects:
Grades:
6th - 9th
CCSS:
Also included in: Middle School Math Digital and Print Activity Bundle Volume 2
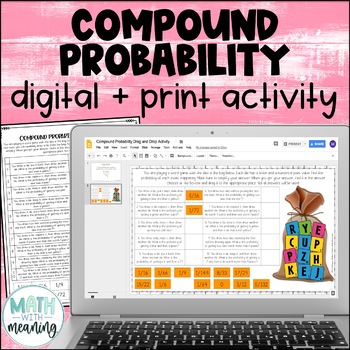
Compound Probability Digital and Print Activity for Google Drive and OneDrive
Looking for an engaging, no-prep activity to practice finding the probability of compound events? Students will use the included image to find the probability of 10 compound events, including both independent and dependent events. They will then find their answer from the answer choices at the bottom and drag it to the appropriate spot. Please view the preview file to make sure that this activity is appropriate for your students.This product includes the following:A link to the digital activity
Subjects:
Grades:
6th - 9th
CCSS:
Also included in: Middle School Math Digital and Print Activity Bundle Volume 1
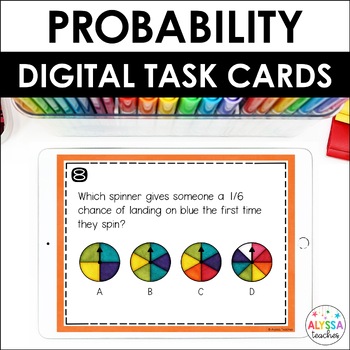
Probability Task Cards (Digital)
Probability is one of my favorite math topics to teach! These digital probability task cards make a great review activity for math centers, warmups, early finishers, and more. You can use this set during your probability unit or save it for an end-of-year test review.To complete the task cards, students move objects on the screen and type answers to questions. They'll complete everything directly in Google Slides. No prep for you; no lost papers for them!Students will:use probability vocabulary
Subjects:
Grades:
4th - 5th
Types:
CCSS:
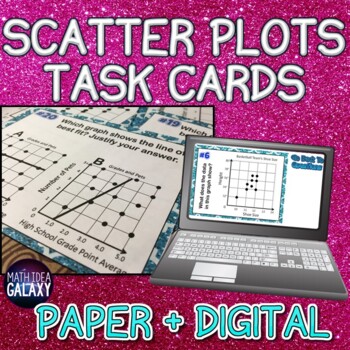
Scatter Plots Task Cards- Printable & Digital Resource
This is an engaging activity for students to practice reading and interpreting scatterplot graphs. Students will practice scatter plots in a variety of ways; these task cards can be used as a game, a center or station, a whole class activity, independent work, or partner practice for concepts related to scatter plots and the line of best fit.These task cards come in both printable AND digital formats. The digital format is built in Google Slides to easily assign to students, and includes answers
Subjects:
Grades:
6th - 8th
Types:
CCSS:
Also included in: Scatter Plots Activity Bundle
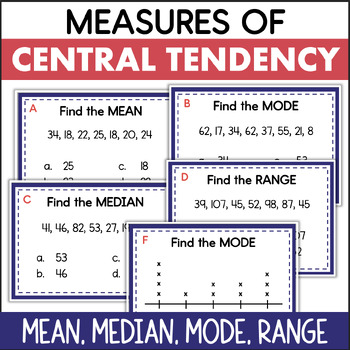
Mean Median Mode Range Measures of Central Tendency Data Task Cards
These data task cards are a great way for students to practice analyzing data to find the mean, median, mode, and range!There are several types of questions, all addressing measures of central tendency. Some require students to interpret a data set of whole numbers. Others involve data presented in a line plot. The last type of question requires the student to choose the correct method for finding the mean, median, mode, or range.This math resource includes:16 task cardsrecording sheetanswer key
Subjects:
Grades:
5th - 7th
Types:
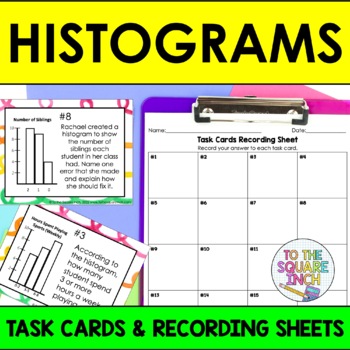
Histogram Task Cards | Histogram Math Center Practice Activity
Boost your students' understanding of histograms with this engaging task card statistics activity. This low-prep set includes 20 task cards that are perfect for reinforcing all aspects of how to read and make histogram charts. With minimal prep required, your students will practice and build these skills in a fun, engaging and out-of-their seat activity perfect for supplementing any lesson. These cards can quickly be set up for a variety of different activities that will make for a more dynam
Subjects:
Grades:
5th - 8th
Types:
CCSS:
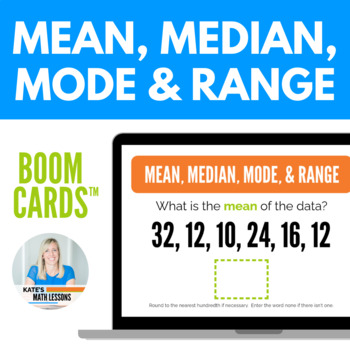
Mean, Median, Mode, & Range Digital Activity Boom Cards™
Working on mean, median, mode, and range? This set of 34 digital task cards is a great way to help students practice finding measures of central tendency: mean, median, mode, and range of a data set (MMMR). Students are shown one question at a time and get instant feedback! The first few cards help students review the meaning of each term before finding the measures of central tendency. Data sets are given as lists of numbers, in tables, or in word problems (you can hide any cards you don't
Subjects:
Grades:
5th - 7th
Types:
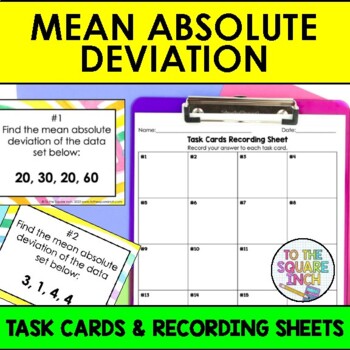
Mean Absolute Deviation Task Cards | Math Center Practice Activity
Boost your students' understanding of mean absolute deviation with this engaging task card statistics activity. This low-prep set includes 20 task cards that are perfect for reinforcing all aspects of how to find mean absolute deviation. With minimal prep required, your students will practice and build these skills in a fun, engaging and out-of-their seat activity perfect for supplementing any lesson. These cards can quickly be set up for a variety of different activities that will make for a
Subjects:
Grades:
5th - 8th
Types:
CCSS:
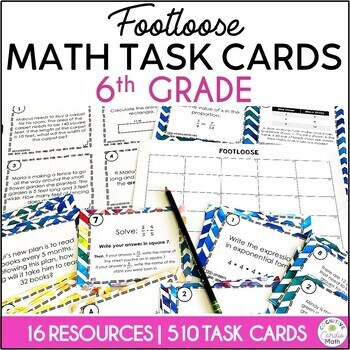
Math Task Card Activities 6th Grade Math Centers, Fractions, Decimals, Ratios
This 6th grade math task card bundle of Footloose task cards is a great way to get students moving while reviewing! Students solve each of the 30 problems in each task card set and record their answers in the corresponding boxes on their Footloose grids.This bundle of easy-prep task cards includes:16 resources, with 17 sets of task cards (Factors and GCF has 2 sets of 30)510 task cards total (30 in each set)16 pages of extra practice and problem solving (these are listed with the topics below)Ea
Subjects:
Grades:
6th
Types:
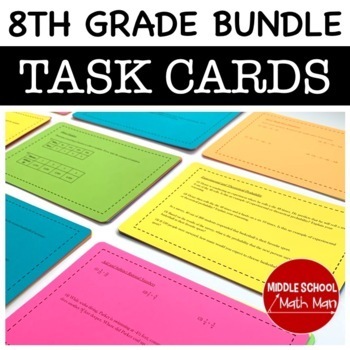
8th Grade Math Task Cards Full Year Bundle
This set of 8th grade math task cards includes the 12 different math units shown below. It consists of 1-4 math problems for each of the following topics, including different algebra, geometry, numbers and operations, probability, and statistics concepts. A total of 276 problems and an answer key IS included! The task cards include a digital Google slides and printable option.To see a free sample of the type of problems included, you can download the following free unit of task cards.8th Grade M
Subjects:
Grades:
7th - 8th
Types:

Sample Space, Tree Diagrams and The Counting Principle
Sample Space, Tree Diagrams and The Counting Principle Interactive Notebook Pages and Activities CCSS: 7.SP.C.8.B
Included in this product:
Sample Spaces Guided Notes (2 per page)
Sample Spaces Practice (2 per page- full color and black and white versions)
Tree Diagrams Guided Notes (2 per page)
Tree Diagrams Practice (2 per page)
The Counting Principle Guided Notes and Practice Mini Book
Answer Keys
Check out the preview to see all pages
Check out my other PROBABILITY PRODUCTS
Backgro
Subjects:
Grades:
6th - 8th
Also included in: 7th Grade Math Interactive Notebook Bundle
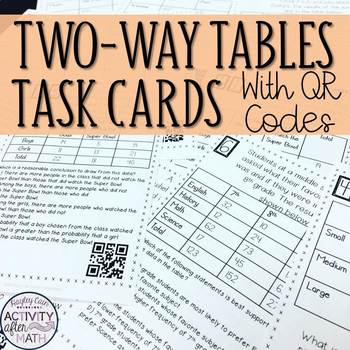
Two-Way Tables (Interpreting Data) Task Cards with QR Codes
Get your students involved with practicing Interpreting Data with Two-Way Tables! This is a great activity that can be used in Math Centers, as individual work, or as a group activity! This gets students moving and also integrates the use of technology into the classroom by scanning QR Codes to check your answer to get immediate feedback!Click here to SAVE and get this as a Task Cards BUNDLEThis resource includes:Teacher InstructionsStudent Instructions20 Task cards with QR codes20 Task cards wi
Subjects:
Grades:
8th - 9th
Types:
CCSS:
Also included in: 8th Grade MATH TASK CARDS BUNDLE
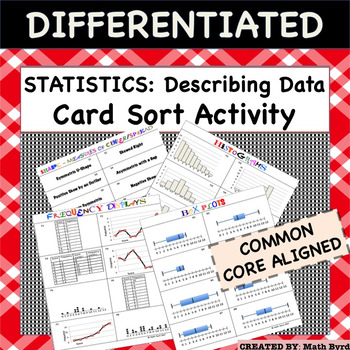
Statistics:Representing & Interpreting Data (Histogram, Box Plot, Dot Plot)
Complete Lesson! This lesson features a 40 CARD SORT, Differentiated Cornell Notes, Distribution Shapes Graphic Organizer, and Power Point to go with the notes! Perfect for the inclusive classroom! Within the Card Sort Activity there are 5 categories of cards to match: 1) Histogram2) Frequency Display (including Dot Plots, Frequency Line Graphs and Tables)3) Box Plots4) Describing Shape5) Describing Measures of Center & Spread. With 8 different sets of matches, there are 40 cards total. Stud
Subjects:
Grades:
8th - 12th
Types:
CCSS:
Also included in: Common Core Algebra 1 CARD SORT ACTIVITIES - BUNDLE PRICE!
Showing 1-24 of 807 results


