48 results
Statistics assessments for Easel Activities
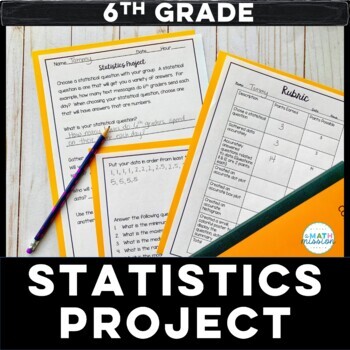
Math Statistics Project Based Learning Dot Plot Box Plot Histogram
Set your students loose to practice their statistics skills! This project is great for a culminating assessment. This project is centered around students coming up with a statistical question, and gathering data on that question. Students answer statistical questions, and create a dot plot, box and whisker plot and histogram based on the data collected. A summary of their findings is then created to display for others to see. A rubric is included for grading purposes. This project actively
Subjects:
Grades:
5th - 7th
Types:
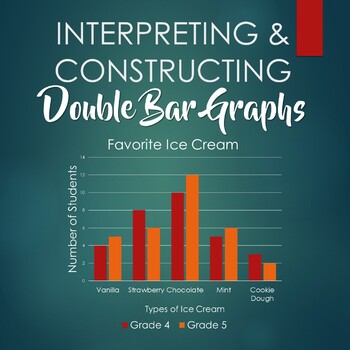
Interpreting and Constructing Double Bar Graphs - Booklet
This booklet includes six worksheets:- 3 double bar graphs for students to interpret- 3 sets of data for students to construct double bar graphs, with corresponding questions- answer key
Subjects:
Grades:
3rd - 6th
Types:
![Preview of Statistics Final Exam and Review [AP, College, and Honors]](https://ecdn.teacherspayteachers.com/thumbitem/Statisticis-FinalReviewStudy-Guide-Exam-1711356723/original-699492-1.jpg)
Statistics Final Exam and Review [AP, College, and Honors]
You can use this Statistics Final Exam in an AP Statistics, Honors Statistics, or a College Statistics course as an assessment, review or both. What's Included?Included are 6 different versions, each including 60 well chosen representative questions in both multiple choice format and also in free response format*. These reviews and tests work well in class or as a take- home. The tests are editable with Adobe Acrobat Pro. Each test should take about 2 - 3 hours and can be taken with a graphin
Subjects:
Grades:
10th - 12th, Higher Education
Types:
CCSS:
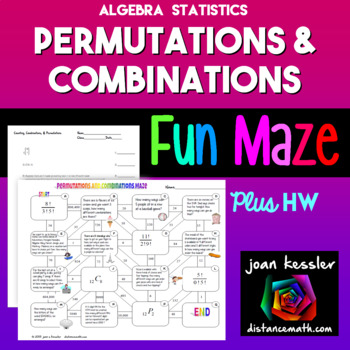
Combinations Permutations FUN Maze plus Quiz HW
This fun activity on Combinations, Permutations, and Counting can be used for Algebra or Statistics and will engage your students while reinforcing the concepts of permutations, combinations, and the counting principles. The different types of problems are placed randomly in the maze so that students must first decide the type of question before solving. The questions on the maze are letter coded so that if a student has a question, he or she can just ask about Question G, for example. There
Subjects:
Grades:
10th - 12th
Types:
CCSS:
Also included in: Algebra 1 Activity Bundle
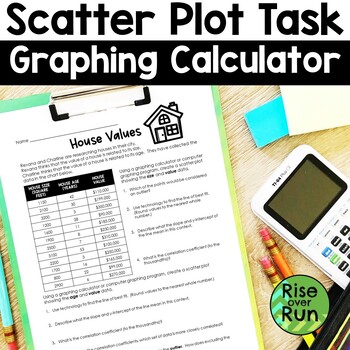
Scatter Plot Worksheet with Graphing Calculator Practice
Need a real world scatter plot activity where students use their graphing calculators? Grab this activity and help your students understand lines of best fit and calculating correlation coefficients!Students are given data on house sizes, house ages, and house values. They use a graphing calculator or computer program to plot the points and answer questions that follow.This is a great activity for partners to explore or for individual work. It can lead to some great math discussions!Answer key
Subjects:
Grades:
8th - 9th
Types:
CCSS:
Also included in: Algebra 1 and 8th Grade Math Curriculum Bundle for Entire Year
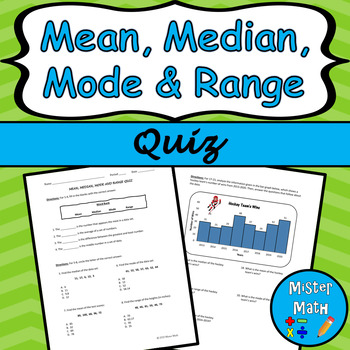
Mean, Median, Mode & Range Quiz
Assess your students' knowledge and skills in finding mean, median, mode and range with this 21-question quiz! The quiz includes fill-in-the-blank, multiple choice, and open-response questions, as well as real-life applications. Students will also be asked to analyze data tables and a bar chart, and calculate the mean, median, mode and range of each data set. An optional challenge activity is included, in which students will be asked to create a data set of their own, place that data into a tabl
Subjects:
Grades:
3rd - 6th
Also included in: Mean, Median, Mode & Range MEGA BUNDLE
Two Way Tables Quiz
Hey Math All-Stars! Are you ready to hit the court and dive into the world of two way tables? Get ready to unleash your inner mathlete with our action-packed quiz, fun questions to keep your students engaged and entertained from start to finish! Why Choose Our Two Way Tables Quiz? Two-Way Table Takedown: Say goodbye to math monotony! Our quiz features 17 thrilling questions focused on constructing and interpreting two-way tables. From volleyball spikes to soccer goals, students will dive deep in
Subjects:
Grades:
8th
Types:
CCSS:
Also included in: Scatterplots Two Way Tables and Residual Plots Worksheets Bundle
ACT Math Test Prep for Probability and Statistics
This ACT resource has 30 questions that cover statistics, probability, number sense, plug and chug, reading tables and charts, scientific notation and more! The answer key comes with explanations for each problem! Standards are included so student can determine weaknesses. You will have access to two versions: PDF and Easel. If you use Easel you will have a copy of the activity that has been digitized and is ready for students to fill in the answers. You can customize it further and then share w
Subjects:
Grades:
10th - 12th
Types:
Also included in: ACT Math Test Prep Bundle
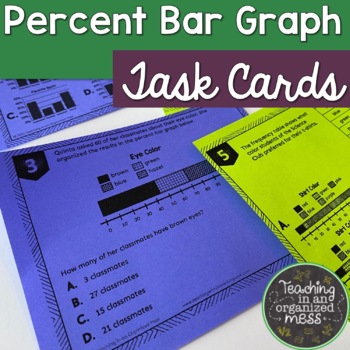
Percent Bar Graph Task Cards Categorical Data Task Cards
Extra Practice for building and interpreting data in percent bar graphs. 16 task cards for students to practice reading and analyzing categorical data organized in percent bar graphs and frequency tables. Students will summarize the data in percent bar graphs. Students will also match frequency tables and percent bar graphs. A recording sheet for students is included. Skills students will practice:summarize data in percent bar graphssummarize data in relative frequency tablesuse data to build p
Subjects:
Grades:
6th
Types:
Also included in: 6th Grade Math GROWING Bundle--6th Grade Math TEKS
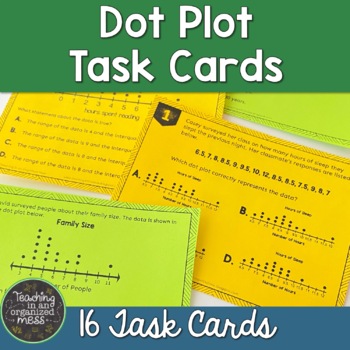
Dot Plot Task Cards-Data Analysis Task Cards
Extra Practice for describing dot plots16 task cards for students to practice reading and analyzing dot plots. Students will describe the center, shape, and spread of dot plots. They will calculate mean, median, mode, range, and interquartile range. Students will also use the dot plots to interpret data. A recording sheet for students is included. Skills students will practice:calculate measures of center (mean, median, mode)calculate spread (range and interquartile range)describe the shape the
Subjects:
Grades:
6th
Types:
Also included in: 6th Grade Math GROWING Bundle--6th Grade Math TEKS
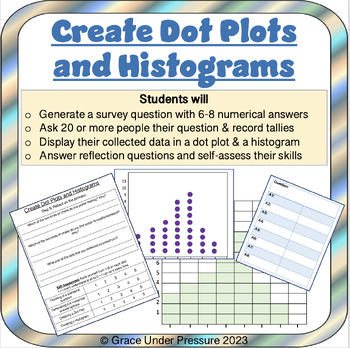
Create Dot or Line Plots and Histograms: Display Numerical Data 6th Grade Stats
Help your 6th grade and middle school math students learn about statistics, data collection, and data presentation in a hands-on and meaningful way! In this product students will:- Generate their own survey question with 6-8 numerical answers (samples included)- Ask 20 or more people their question & record answers in a tally chart- Display their collected data in a dot plot or line plot and then a histogram (the blank templates are included so all students can be successful)- Answer reflect
Subjects:
Grades:
5th - 8th
Types:
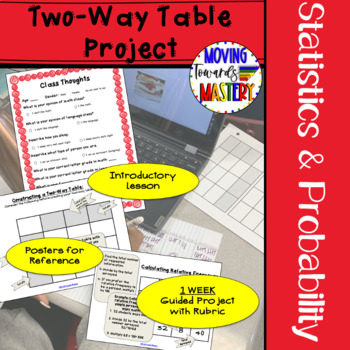
Two Way Frequency Tables End of Year Project Plan
ONE Week guided project plan for constructing and interpreting two-way frequency tables. This engaging project is individualized to allow students to research areas of interest. Can be used year round but is great for an end of year project! Students will gather data on their topic of choice and use the project plan to organize their data into a two way table and frequency table. Students will then analyze the results of the data collection.Two-Way Table Project includes:♦ Suggested Lesson Plann
Subjects:
Grades:
8th - 10th
Types:
CCSS:
Also included in: Middle School Math Projects for End of the Year Activities
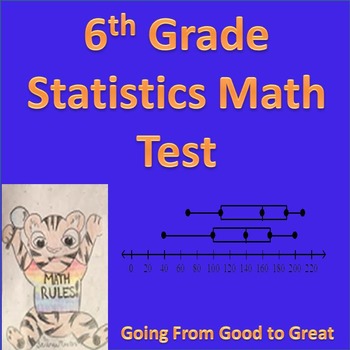
6th Grade Statistics Math Test
This test covers the 6th grade statistics common core standards. Using PARCC and MCAS questions. This covers all the 6th statistics standards. The topics include mean, median, mode, range, histograms, box and whiskiers, dot plots, outliers, and skewers. Answer key included.
**This is also included in a year-long math test bundle that includes 9 unit tests, study guides, test with goals and challenging test covering all the 6th grade Common Core Math Standards. Get the bundle here:
6th Grade
Subjects:
Grades:
5th - 8th
Types:
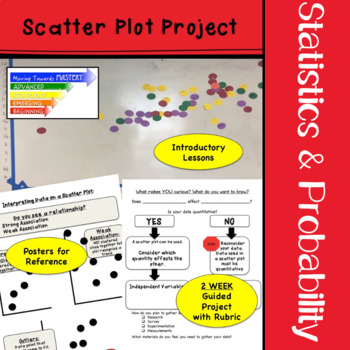
Scatter Plot Project End of Year Math Activity with Real World Data
TWO Week guided project for constructing and interpreting scatter plots. This engaging scatter plot project is individualized to allow students to research areas of interest. This project is great for a math end of year activity but it can also be used year round! Students will gather data on their topic of choice and use the project plan to organize their data into a scatter plot. Students will then analyze the results of the data collected.Six posters to guide students as they work independent
Subjects:
Grades:
8th - 10th, Higher Education
Types:
CCSS:
Also included in: Middle School Math Projects for End of the Year Activities
Probability Quiz
Assess your students' knowledge and skills in finding probability with this 22-question quiz! The quiz includes multiple choice and open-response questions, as well as real-life application questions. An answer key is also provided. Overall, the 4-page quiz covers the following topics:Outcomes & EventsDescribing LikelihoodSimple ProbabilityTheoretical/Experimental ProbabilityUsing Theoretical ProbabilityMaking PredictionsComparing Theoretical & Experimental Probability☆ CLICK HERE TO CHE
Subjects:
Grades:
6th - 9th
Also included in: Probability MEGA BUNDLE
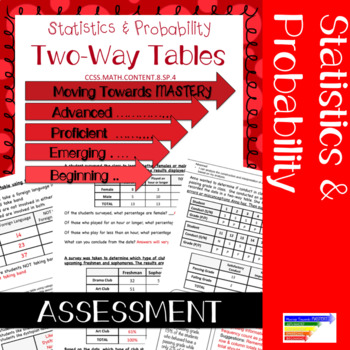
Two Way Frequency Tables Printable Test 8.SP.4 Assessment
Assessment for Two Way Frequency Tables - This printable test will measure understanding at various levels of mastery to identify at what level students have progressed. Levels of mastery are:→ Beginning → Emerging→ Proficient→ AdvancedEASY printing with answer keyCheck out resources for teaching Scatter Plots:Scatter Plot Interactive Google SlidesScatter Plot ProjectScatter Plot PRINTABLECheck out the levels of mastery tool created to introduce the standard in my store:Scatter Plot Levels of Ma
Subjects:
Grades:
8th - 10th
Types:
CCSS:
Also included in: 8th Grade Common Core Statistics & Probability Assessments
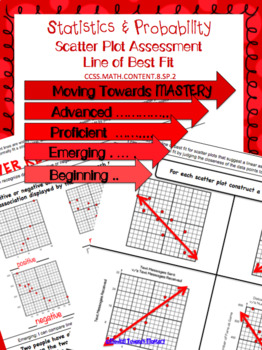
8.SP.2 Scatter Plots: Line of Best Fit Assessment
Assessment for Scatter Plots: Line of Best Fit that measures understanding at various levels of mastery to identify at what level students have progressed. Levels of mastery are:→ Beginning → Emerging→ Proficient→ AdvancedEASY printing with answer key--------------------------------------------------------------------------------------------------------------------------------------------------------------These printable worksheets can also be used as digital resources through the TpT Digital Ac
Subjects:
Grades:
8th - 10th
Types:
CCSS:
Also included in: 8th Grade Common Core Statistics & Probability Assessments
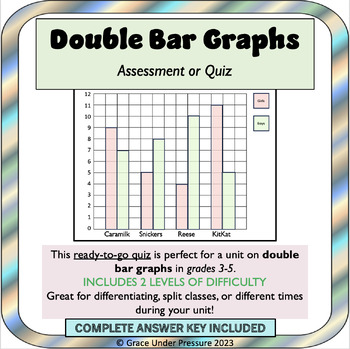
Bar Graphs: Double Bar Graph Math Quiz (Grades 3-5) Differentiated
This ready-to-go math quiz is perfect for a graphing unit on double bar graphs in grades 3-5. The first page uses a double bar graph with one-to-one correspondence. The second page uses a double bar graph with many-to-one correspondence (one square represents four people). Students have to determine that half a square represents two people since a whole square represents 4 people.Great for differentiating, split classes, or different times during your unit!Grades to Use With:This math assessment
Subjects:
Grades:
3rd - 5th
Types:
CCSS:
Mean, Median, Mode & Range Review | Printable, Digital & Easel
A NO-PREP resource to review HIGH-YIELD topics in science! My science review sorts help students develop mastery of science concepts, review difficult concepts and avert common misconceptions and misunderstandings. Each individual review sort will target a specific topic. By doing so, students focus their attention and effort on advancing their understanding of scientific ideas and concepts related to that topic. Important Notes:• Download a FREE High-Yield Review Activity• Save $$ with the Natu
Subjects:
Grades:
4th - 9th
Types:
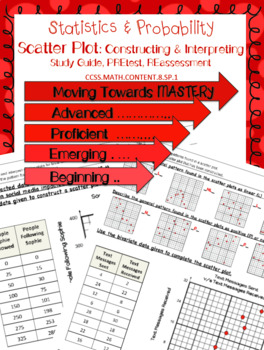
8.SP.1 Construct & Interpret Scatter Plots Pre-test/ Study Guide/ Reassessment
This resource would be useful in the following ways:→ Pre-test before introducing the standard→ Study Guide to prepare for the assessment→ Reassessment This resource will allow you to measure student understanding of how to construct and interpret a scatter plot at various levels of mastery to identify at what level students are prior to instruction or after instruction. Levels of mastery are:→ Beginning → Emerging→ Proficient→ AdvancedEASY printing with answer key-------------------------------
Subjects:
Grades:
8th - 10th
CCSS:
Also included in: 8th Grade Common Core Statistics & Probability Assessments
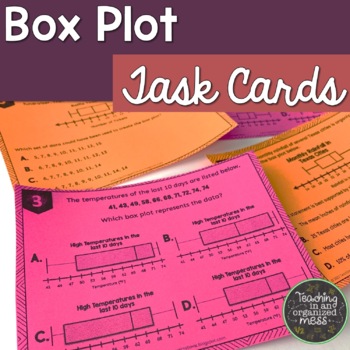
Box Plot Task Cards-Data Analysis Task Cards
Extra Practice for describing Box Plots16 task cards for students to practice reading and analyzing box plots. Students will describe the center, shape, and spread of box plots. They will calculate, median, range, and interquartile range. Students will also use the box plots to interpret data. A recording sheet for students is included. Skills students will practice:find the 5 number summarycalculate spread (range and interquartile range)interpret the data in the graphmatch data to box plotsThe
Subjects:
Grades:
6th
Types:
Also included in: 6th Grade Math GROWING Bundle--6th Grade Math TEKS
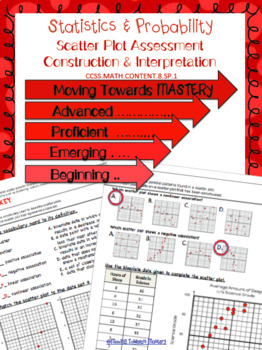
8.SP.1 Scatter Plots: Construction & Interpretation Assessment
Assessment for Scatter Plots: Construction & Interpretation that measures understanding at various levels of mastery to identify at what level students have progressed. Levels of mastery are:→ Beginning → Emerging→ Proficient→ AdvancedEASY printing with answer key--------------------------------------------------------------------------------------------------------------------------------------------------------------These printable worksheets can also be used as digital resources through t
Subjects:
Grades:
8th, Higher Education
Types:
CCSS:
Also included in: 8th Grade Common Core Statistics & Probability Assessments
6th Grade Statistics Study Guide
This test covers the 6th grade statistics common core standards. Using PARCC and MCAS questions. This covers all the 6th statistics standards. The topics include mean, median, mode, range, histograms, box and whiskiers, dot plots, outliers, and skewers. Answer key included. This goes with the Statistics test in my store.
**This is also included in a year-long math test bundle that includes 9 unit tests, study guides, test with goals and challenging test covering all the 6th grade Common Core
Subjects:
Grades:
5th - 7th
Types:
Also included in: Statistics Test Bundle
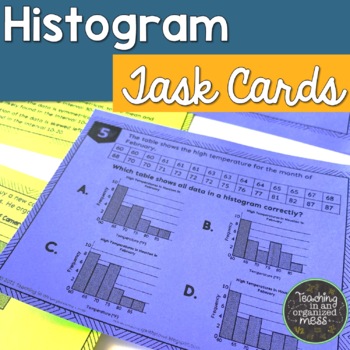
Histogram Task Cards Statistics and Data Analysis Task Cards
Extra Practice for building and interpreting data in Histograms. 16 task cards for students to practice reading and analyzing histograms. Students will describe the shape and intervals of histograms. Students will also use the histograms to interpret the data. A recording sheet for students is included. Skills students will practice:describe the shape of histogramsdescribe the intervals of histogrambuild histograms with a given data setinterpret data in a histogramThe download includes the task
Subjects:
Grades:
6th
Types:
Also included in: 6th Grade Math GROWING Bundle--6th Grade Math TEKS
Showing 1-24 of 48 results


