8 results
Statistics assessment interactive whiteboards
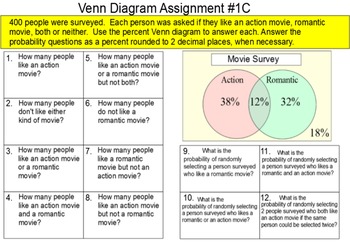
Venn Diagrams with Probability, 2 Lessons + 16 Assignments for SMART
Included in this zip folder are 19 SMART Notebook files. 2 are for instruction, 1 is a student reference handout and 13 are assignments. A brief description of each:
Instruction file #1 is a 36 slide introduction to reading a Venn diagram. Some formative assessment problems are included.
Instruction file #2 is a 25 slide introduction to the complement of a set in a Venn diagram.
Assignment A is a matching assignment. The student matches 10 2 circle Venn diagrams with union, intersection and
Subjects:
Grades:
8th - 11th
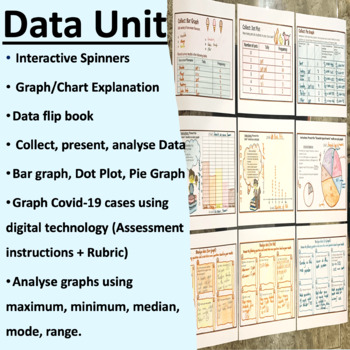
Graphing and Data Analysis Unit for years 5 and 6 (Collect. Present. Analyse)
By purchasing this bundle, you will save 10% off individual resources! Interactive data spinner game included to teach, review, or even assess data understanding for year 5 and year 6 students!Included: + Formative assessment of data through a brainstorm activity+ Data Display Interactive Spinner Game (12 Graphs/Charts)+ Detailed explanation of answers to the spinner questions (Graph/Chart features and characteristics outlined)+ Student booklet included with worksheets+ PowerPointTM presentation
Subjects:
Grades:
5th - 6th
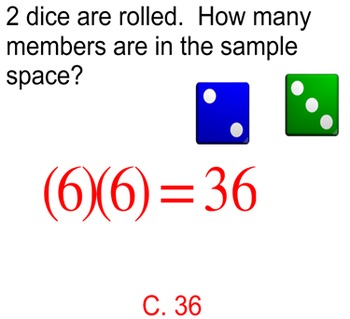
Probability of a Single Event, Independent & Dependent Events for SMART
Included in this zip folder are 17 SMART Notebook files. 4 files are Introductory lessons, 6 files are assignments and 5 files are references for students. A brief description of each:
Intro #1 is a 36 page file that introduces the fundamental counting principle. Sample space is defined as the total outcomes found via the counting principle. 12 formative assessment problems are included in the file.
Intro #2 is a 41 slide file that introduces the concept of "and" and "or" as intersection an
Subjects:
Grades:
8th - 11th
Analyze Data Sets - 6.SP.5
Students analyze data by identifying data landmarks, recognizing quartiles, interpreting box plots and histograms. Scaffolded lesson provides for classroom differentiation. Can be used as a lesson leader, guided practice, independent practice, for cooperative learning and math centers, or as an assessment. Use with smartboard, projector, computer, pad or as printable. Lesson is complete - NO PREP.
Objectives:
- Report on observations
- Describing how data was measured
- Quantifying measurements
Subjects:
Grades:
5th - 8th

SORTING WITH VENN DIAGRAMS 1 - GOOGLE SLIDES
Students are presented with three types of Venn Diagrams and a set of data. Slides are interactive, allowing students to move the numbers into the correct position on the diagrams.
Subjects:
Grades:
3rd - 5th
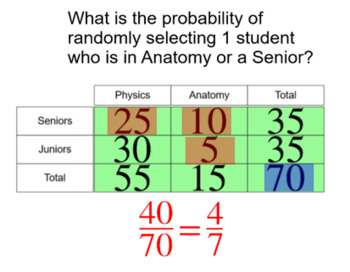
2 Way Frequency Tables, 2 Lessons and 5 Assignments for SMART
Included in this zip folder are 7 Power Point files. 2 are for instruction and 5 are assignments. A brief description of each:
Instruction file #1 is a 22 slide file. The emphasis is reading a 2 way frequency table. Intersection and union are also introduced.
Instruction file #2 is a 19 slide file. Conditional probability is the emphasis of this lesson.
Assignment file #1 is a 24 question assignment. The student is asked to read a 2 way frequency table with and without intersection and unio
Subjects:
Grades:
8th - 11th
Statistics and Sampling - 7.SP.1
Understand valid random sampling can provide information and generalizations regarding a select population. Scaffolded lesson provides for classroom differentiation. Can be used as a lesson leader, guided practice, independent practice, for cooperative learning and math centers, or as an assessment. Use with smartboard, projector, computer, pad or as printable. Lesson is complete - NO PREP. Editable version included.
Objectives:
- Define terms related to statistics
- Recognize methods of random
Subjects:
Grades:
6th - 8th
CCSS:
Interactive Math: Slope and Slope Intercept Form
This is a must have for students in your Algebra class. The fun and engaging slideshow will give students an assessment of their skills in slope-intercept form. Students who struggle with the concept will be given tips for each incorrect answer and when to graphing equation.Types of questions include:Identifying slope and interceptTransforming equations into both standard and slope-intercept form.Identifying equation fro graph.Graphing linear equations in slope-intercept form.The zip file includ
Subjects:
Grades:
8th - 10th, Adult Education
CCSS:
Showing 1-8 of 8 results


