TPT
Total:
$0.00

Math Statistics Project Based Learning Dot Plot Box Plot Histogram

Rated 4.79 out of 5, based on 14 reviews
4.8 (14 ratings)
;
A Math Mission by Lisa Yeip
585 Followers
Grade Levels
5th - 7th
Subjects
Standards
Formats Included
  • PDF
Pages
9 pages
$3.00
$3.00
Share this resource
Report this resource to TPT
A Math Mission by Lisa Yeip
585 Followers
Easel Activity Included
This resource includes a ready-to-use interactive activity students can complete on any device.  Easel by TPT is free to use! Learn more.

What educators are saying

Great resource! This was a great way for my students (with disabilities) to see how the math they were learning in class could be used in real-life!
I used this project with my Advanced Math class; they loved it! Everything was structured, so I just needed to print copies and review the rubric. They were thrilled to complete this independently and have some freedom to move around "gathering data". This was a definite hit!

Description

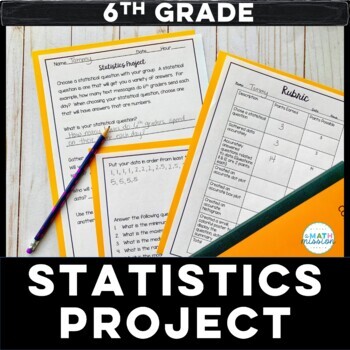
Set your students loose to practice their statistics skills! This project is great for a culminating assessment.

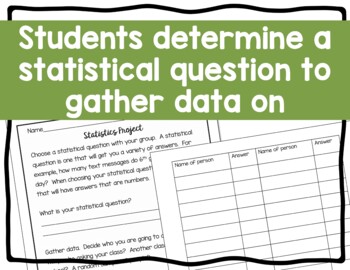
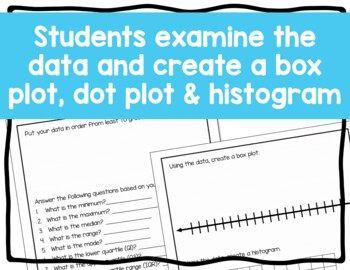
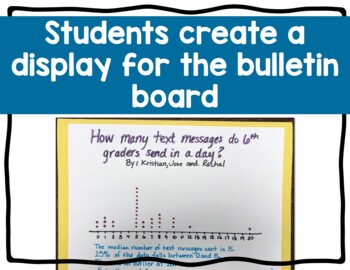
This project is centered around students coming up with a statistical question, and gathering data on that question. Students answer statistical questions, and create a dot plot, box and whisker plot and histogram based on the data collected. A summary of their findings is then created to display for others to see. A rubric is included for grading purposes.

This project actively involves the participants in the understanding of the statistics concepts.

This product is EDITABLE. To edit, download to your computer and open in Adobe. Click on "edit PDF".

If you are interested in more like this, check out Basketball Statistics and Baseball Statistics.

Follow me for notification of new products and sales!

Total Pages
9 pages
Answer Key
Rubric only
Teaching Duration
N/A
Report this resource to TPT
Reported resources will be reviewed by our team. Report this resource to let us know if this resource violates TPT’s content guidelines.

Standards

to see state-specific standards (only available in the US).
Recognize a statistical question as one that anticipates variability in the data related to the question and accounts for it in the answers. For example, “How old am I?” is not a statistical question, but “How old are the students in my school?” is a statistical question because one anticipates variability in students’ ages.
Understand that a set of data collected to answer a statistical question has a distribution which can be described by its center, spread, and overall shape.
Recognize that a measure of center for a numerical data set summarizes all of its values with a single number, while a measure of variation describes how its values vary with a single number.
Display numerical data in plots on a number line, including dot plots, histograms, and box plots.
Summarize numerical data sets in relation to their context, such as by:

Reviews

Questions & Answers