393 results
Graphing project microsofts
Lucky Charms Cereal Data Analysis and Graphing Project St. Patrick's Day
Looking for a way to review data analysis and graphing skills without it being a bore? This Lucky Charms Cereal Data Analysis and Graphing Project is a fun activity to incorporate in March for St. Patrick's Day, but of course it works at any time of the year in a graphing unit or in a math-integrated unit. Your students will smile when you whip out the box of Lucky Charms and tell them that they are to pretend they are the Quality Control Department at the Cereal Company! This activity is fun an
Subjects:
Grades:
6th - 8th
Types:
NGSS:
MS-ETS1-4
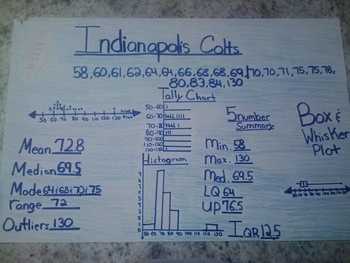
Favorite Sports Team: Data Displays and Measures of Central Tendency Project
Students will create a poster using sports statistics. Depending on the time of year, you may want to use football scores, basketball scores, data from the Olympics, etc. Students will use the internet (or you can print out statistics for them) to find sports data.
The students really buy into this project because it is about something they are interested in - their favorite sports team!
Students will display their knowledge of several data displays: line plot, tally chart, histogram and bo
Subjects:
Grades:
5th - 8th
Types:
Coordinate Plane Amusement Park Project
This 11-page project packet is designed for students to create a "blue print" of their own amusement park. Packet also includes 3 pages of teacher directions/tips and a checklist. This is a culminating unit project to be used at the end of a unit on integers/graphing in the coordinate plane. By following the steps in each of five tasks, students create an amusement park using all four quadrants of the coordinate plane. Students demonstrate understanding of plotting points on the coordinate pl
Grades:
6th - 7th
Types:
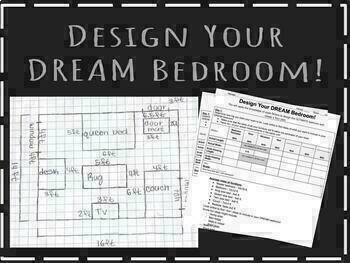
Fun Scale Drawing Project! (Minimal Prep)
Students will apply the knowledge of scale and scale factors to design their DREAM bedroom and create a floor plan! VERY MINIMAL PREP- all you have to do is print out the packets! Link for the project introduction Google slides included on the first page. Graph paper included on the third page.
Subjects:
Grades:
7th - 8th
Types:
CCSS:
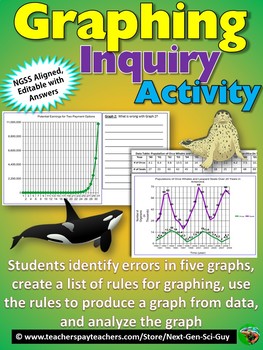
Graphing Inquiry Activity: NGSS Graphing and Data Analysis: Distance Learning
This activity proceeds as follows:1. Students are given a hypothetical scenario in which they are offered two different payment options for house-sitting a wealthy neighbor's house, and have to fill in a data table by calculating the earnings for each option 2. Students then evaluate five different graphs, each of which incorrectly represents the data in some way. They must find the mistakes.3. Students then generate a list of rules for proper graphing4. Students use their rules, and data on or
Grades:
7th - 12th
Types:
3rd Grade Data
3rd Grade Data: This third grade resource on data includes a PowerPoint on four types of data, a small group project using data, a foldable graphic organizer on data, and a quiz on collecting, organizing, displaying and interpreting data for Third Grade TEKS 3.8A and 3.8B: This bundle of resources is closely aligned to the Texas Math Standards TEKS 3.8A and 3.8B. The 30 slide PowerPoint presentation introduces word problems related to everyday life. It includes problems with bar graphs, pict
Subjects:
Grades:
3rd
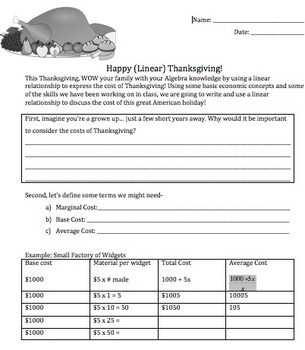
Thanksgiving Math: Linear Equation Thanksgiving Dinner Project for Algebra 1
Harnessing the energy my students come in with right before break, I have created a one-period project in which they are going to create a linear equation related to a Thanksgiving meal. It is sometimes hard for students to create their own equations, but I am hoping that this scaffolded project will be something we can reference for the rest of our linear equations unit!The assignment sheet takes students through some quick new vocab related to economics (definitions included) and provides a ba
Subjects:
Grades:
7th - 10th
Types:
CCSS:
Paper Airplane 5th Grade Common Core 5.MD.2 Line Plot Performance Task
This task allows students to work in groups to construct a paper airplane, fly it, measure the distance flown, and then create a line plot based on their data. This comes with student friendly instructions, and guiding questions for students to complete following the completion of their line plot. This corresponds with the fifth grade Common Core Math standards for line plots. This could be adjusted to fit fourth grade line plot standards.
Subjects:
Grades:
4th - 5th
Types:
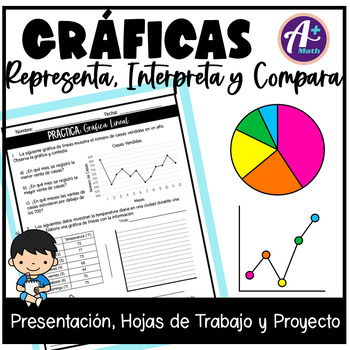
Gráficas - Estadística
Gráficas - Estadística - Analizar DatosEste recurso trabaja los siguientes temas:Gráficas: Representa, Interpreta y Compara•Recopilar y Organizar Datos •Tabla de Frecuencias•Gráfica de Barras•Gráfica Circular•Gráfica Pictórica•Gráfica Lineal•Tabla de Tallo y Hojas•Diagrama de PuntosEl recurso incluye:•Presentación en PowerPoint y PDF - 55 diapositivas con explicaciones y ejemplos•8 hojas de trabajo - Incluye la clave de respuestas•3 hojas de trabajo - Proyecto - Encuesta y analiza los res
Subjects:
Grades:
4th - 6th
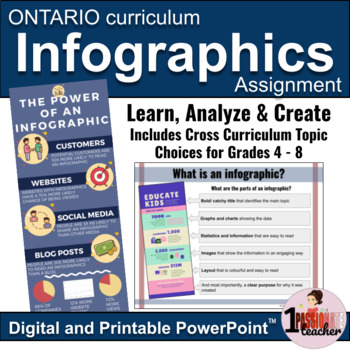
Infographics | New Ontario Math Curriculum 2020 | Editable PowerPoint
Teach your students about the power of using infographics in data management to tell a story about any topic. This lesson, practice and creation activity is as flexible as you need it to be right now. Includes rubrics and multiple curriculum topic suggestions for grades 4, 5, 6, 7 and 8 from Ontario curriculum expectations, including the New Ontario Math Curriculum 2020 and can be used for virtual or in-person learning.And like with all of my products, this resource is completely editable! Perfe
Subjects:
Grades:
4th - 8th
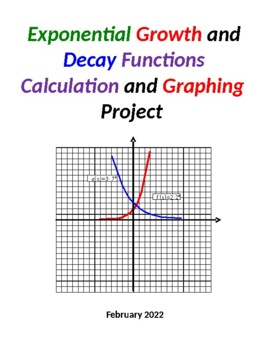
Exponential Growth & Decay Functions Calculation & Graphing Project
PLEASE NOTE: THE PREVIEW VERSION OF THIS PRODUCT IS THE ACTUAL "STUDENT VERSION" AND DOES NOT INCLUDE ANY OF THE ANSWERS TO THE PROBLEMS. THE "PRODUCT VERSION" INCLUDES DETAILED ANSWERS TO ALL OF THE PROBLEMS FOR THE PROJECT.This activity involves the calculation, graphing and coloring of exponential growth and decay functions. I have my Algebra 1/Math 1/Math 2 students complete this project toward the end of the unit on exponential functions.A total of five (5) exponential growth functions a
Subjects:
Grades:
8th - 10th
CCSS:

Scatter Plot and Bivariate Data Research Project
Students will begin a statistics project on one of their favorite restaurants or food chains! They will be researching nutrition facts and surveying others on what types of food they like to eat there. Through this data collection they will work on their skills of creating scatter plot graphs, creating relative frequency tables, and analyzing this data. This can be used either by paper or digitally. I used it the last two years during distance learning. Rubric included.
Subjects:
Grades:
7th - 12th
Types:
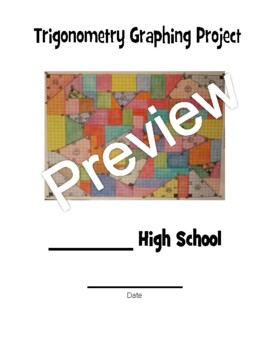
Trigonometry Graphing Project
The purpose of this project is to give your students a deeper understanding of the use of trigonometry in analyzing various types of triangles. It will also provide them with an interesting and colorful way to display various triangles and their properties and dimensions in a single area so that they can see the difference in the type and shape of these triangles. The project requires the students to use the 3 basic trig functions (sine, cosine and tangent) and their inverses as well as the La
Subjects:
Grades:
9th - 11th
CCSS:
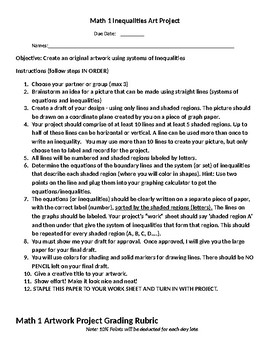
Algebra 1 Systems of Linear Inequalities Art Project
This project allows students to practice graphing systems of linear inequalities to create a picture made up of shaded areas. Includeds detailed directions and a grading rubric. I provided my students with graph paper to do their draft on, then large poster size grid paper to do their final project. Students worked in groups of 2 to 4.
Subjects:
Grades:
8th - 11th
Types:
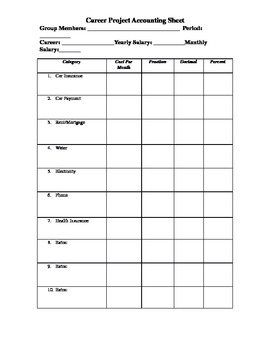
Career Monthly Bils Circle Graph Project
In this project students draw a career and select 10 of their monthly bills. They then figure what percent of their monthly salary goes to each item and create a circle graph showing where their money goes. The file you will receive includes a rubric for the project, an accountability sheet, 24 "career cards", a list of choices for the 7 required and 3 choice items in the project, and teachers notes about how the project has been made successful in their class. It is a word document so any of th
Subjects:
Grades:
6th - 8th
Types:

Culminating 8th Grade Math Project: Amusement Park Tycoon
This resource is designed for students to review and engage in the focus standards for 8th grade mathematics in a fun and interactive way. This project has three parts to it;1. Amusement Park Proposal; this is the attached document which contains the mathematical tasks based on the skills listed below.2. Blueprint; students should create a blueprint of their proposed park on grid paper (I found a roll of extremely large grid paper on Amazon)3. 3D Model; after completing the proposal and blueprin
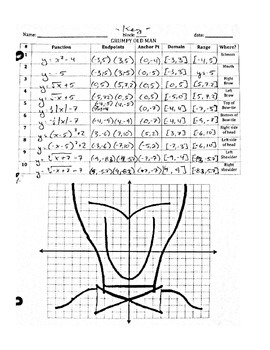
Function Transformation: Grumpy Old Man
Students must create functions based off commands. When they are graphed together (on paper and on a graphing calculator) they create an image of a grumpy old man. I use this activity before I have the students create their own image on Desmos.com. They say it is really helpful for them.
Practices:
- Function transformation with linear, absolute value, quadratic, square root, cubic, and cubed root functions.
- Finding domain and range.
- Finding key/anchor points.
- Graphing with restricted
Subjects:
Grades:
10th - 12th
Types:
CCSS:
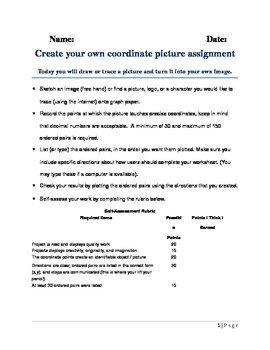
Create your own coordinate plane picture.
The create your own coordinate plane picture project is a 3 or 4 class period assignment where students take a picture or logo and then they use ordered pairs to recreate the picture. This project guides the student through the process of creating, accessing, peer assessing, and finalizing their picture. Three rubrics are included, one for self assessment, peer assessment, and finally teacher assessment. I used this project in my math elective class and students love the differentiation comp
Grades:
4th - 8th
Types:
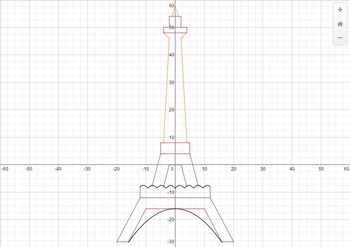
Linear Equations Project - Graphing the Eiffel Tower
Discover linear equations the fun way. This is a 5 day project that is ready to use. Implementing it in your class will be as easy as pi.
Students will need access to a computer or iPad. They will use a powerful online graphing calculator to create a drawing of the Eiffel tower via www.desmos.com.
Students will learn about:
Writing linear equations in point-slope form
Writing linear equations in slope-intercept form
Writing equations of parallel lines
Graphing horizontal and vertical lines
Subjects:
Grades:
8th - 12th
CCSS:
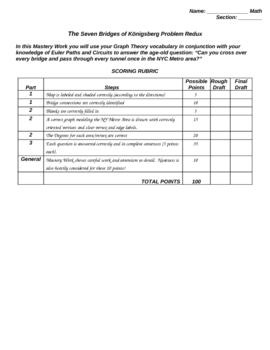
Konigsberg Bridge Problem in NYC!
This is a project that uses Graph Theory, and Euler Circuits and Paths to solve an updated version of the Konigsberg Bridge Problem. The city of Konigsberg in Prussia (now Kaliningrad, Russia) was set on both sides of the Pregel River, and included two large islands, which were connected to each other and the mainland by seven bridges. The problem was to find a walk through the city that would cross each bridge once and only once. The islands could not be reached by any route other than the br
Subjects:
Grades:
8th - 11th
Types:
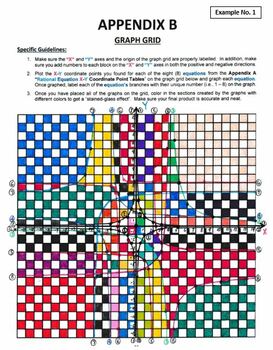
Rational Functions Calculation and Graphing Project
PLEASE NOTE: THE PREVIEW VERSION OF THIS PRODUCT IS THE ACTUAL "STUDENT VERSION" AND DOES NOT INCLUDE ANY OF THE ANSWERS TO THE PROBLEMS. THE PRODUCT VERSION INCLUDES DETAILED ANSWERS TO ALL OF THE PROBLEMS FOR THE PROJECT.This project activity involves the calculation, graphing and coloring of basic rational functions/equations. I have my Algebra 2, Math 3 and Precalculus students complete this project toward the end of the unit on rational functions. As noted in the TpT "Preview" section o
Subjects:
Grades:
10th - 12th
Types:
CCSS:
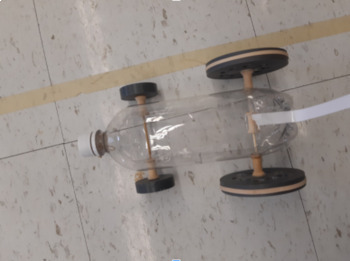
Physics Kinematics Rubber Band Car Project
This is a hands-on project that gives students a chance to use creativity and the design process to learn about displacement, velocity, and acceleration. The Rubber Band Car Competition is probably best used in a Physics class setting, but it would work in a Gr. 9 - 10 science classroom as well. Included: Teacher preparation document with list of outcomes, materials, etc., student handout sheet with rubric for hand-in material, and student-produced example of hand-in material.
Subjects:
Grades:
9th - 12th
Types:
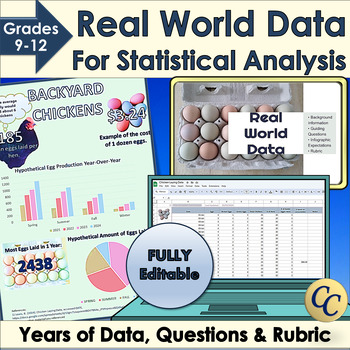
Real World Data for Statistical Analysis and Infographic Project
Give your students access to real world data for your statistical analysis unit or data literacy! Dive into statistics with Microsoft Excel™ or Google Sheets™ and years of data. Learn how to use standard deviation, mean or median to interpret data. Choose the best graphs to display conclusions in an infographic. Works great for science fairs! ✔ Includes an infographic project! (Template, expectations, and rubric). ✔ Everything is fully editable and you and your students can even use the images
Grades:
9th - 12th
Types:
CCSS:
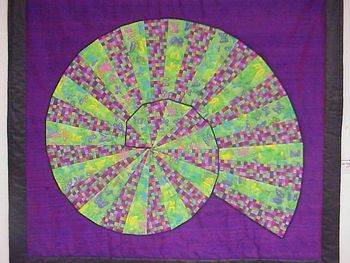
Pythagorean Spiral project.
The Pythagorean spiral project uses the Pythagorean Theorem to create a beautiful spiral if done correctly. This can be used from Pre-Algebra all the way to graduation as a good way to teach the Pythagorean Theorem as well as constructions. Have the student decorate the spiral after to add some flare to their work!
A rubric is included for easy grading.
Grades:
5th - 12th
Types:
CCSS:
Showing 1-24 of 393 results


