1,076 results
Graphing assessment microsofts
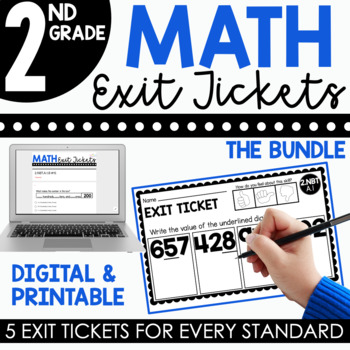
2nd Grade Math Exit Tickets (Exit Slips) Bundle | Printable & Digital Included
UPDATE: This resource now includes digital exit tickets on Google Forms(TM). They can be assigned on any online platform and are auto-graded!Exit Tickets are a great tool to quickly assess your students' understanding of a concept. Exit tickets should take no longer than a couple of minutes to complete and they provide the teacher with valuable information to help guide their instruction.Please download the preview file above for a closer look at what's included!This set of exit tickets cover A
Subjects:
Grades:
2nd
Types:
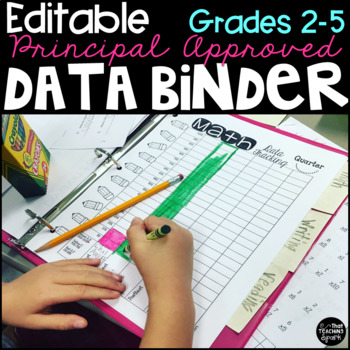
Editable Student Data Tracking Binder Grades 2-5
Ready to watch your students' score skyrocket? Allow them to start tracking their own data! Have your kiddos record their pretests, set goals, learn, and then watch as their post test scores blow you away! Perfect for educators who are evaluated using the Marzano Evaluation Model. This file is editable!
Download the preview to see all the magic included!
This Data Binder includes...
Every page below (except math facts) includes a NONeditable AND an EDITABLE version!
Girl Binder Cover
Boy
Grades:
2nd - 5th
Types:

Beaker Pong: Experimental Design and Graphing Lab, NGSS aligned
Great 1st week or 1st month STEM activity! All parts are EDITABLE and includes a graphing grid! This is a great way to introduce the "science process" (better phrase for scientific method) at the start of a semester or anytime you want fun to occur in your classroom.*****Focus on the NGSS PRACTICES Dimension*****The National Research Council's (NRC) Framework describes a vision of what it means to be proficient in science; it rests on a view of science as both a body of knowledge and an evidenc
Subjects:
Grades:
7th - 12th
Types:
Graph Points on the Coordinate Plane (Mini Bundle) - Distance Learning
This is an awesome bundled lesson that will have your kids accurately graphing points on the coordinate plane in no time.Included in this bundled unit:PowerPointThe entertaining, interactive, and easy-to-understand 17-slide PowerPoint walks learners through:-The development of the coordinate plane-Basic graphing and coordinate plane terminology: x-axis, y-axis, ordered pair, coordinates, origin, quadrant, etc.-Plotting point demonstrations-Various plotting point practice (three slides)These embe
Subjects:
Grades:
5th - 6th
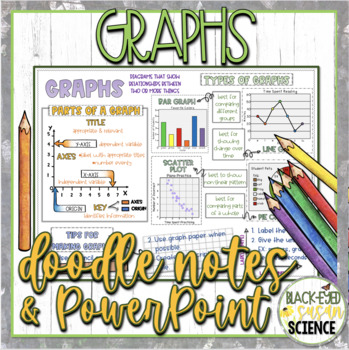
Graphs Doodle Notes & Quiz + Power Point
-DIFFERENTIATED CONCEPT NOTES -QUIZ -ANSWER KEYS -RIGOROUSDo your students love to doodle while taking notes? Don't fight it, embrace it with Doodle Notes (aka Squiggle Sheets)!!!These notes are not only fun but help students to meet Next Generation Science Standards.Notes are differentiated. 3 versions are included. Use the included answer key or choose to use the blank version to make the notes your own.Some things covered in these notes:parts of graphstipstypes of graphsbarlinecirclescatter
Grades:
6th - 8th
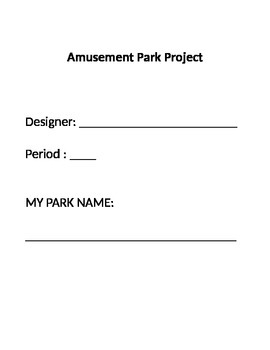
Coordinate Plane Amusement Park Project
This 11-page project packet is designed for students to create a "blue print" of their own amusement park. Packet also includes 3 pages of teacher directions/tips and a checklist. This is a culminating unit project to be used at the end of a unit on integers/graphing in the coordinate plane. By following the steps in each of five tasks, students create an amusement park using all four quadrants of the coordinate plane. Students demonstrate understanding of plotting points on the coordinate pl
Grades:
6th - 7th
Types:
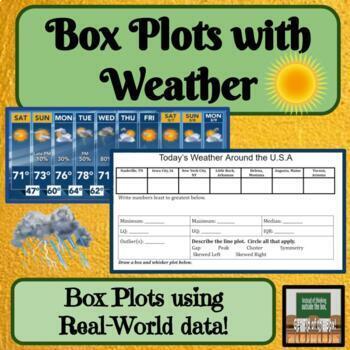
Box and Whisker Plots Real World Math Middle School Math
About this Resource:Students use current weather data from all over to create box plots using measures of variation. This is a create way to tie in some live science data! Topic Covered:*Measures of Variation/Variability*Describing Graphs*Box Plots / Box-and-Whisker Plots Ways to use this product in your classroom:-project-assessment-independent or partner work✓ Teacher Tested✓ Student Approved*This product has been used in my classroom and enjoyed by my students!Other products with similar con
Subjects:
Grades:
6th - 8th
Types:
Also included in: Box and Whisker Plots Line Plots Measures of Center Bundle Activities
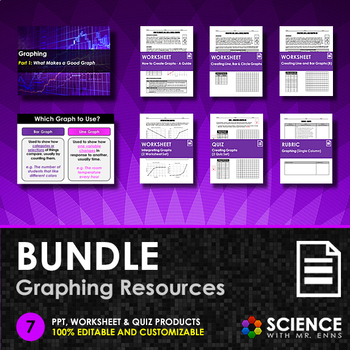
Graphing Skills or Making Graphs Unit Bundle on Line, Bar, and Circle Graphs
This bundle contains 7 graphing resources that forms a suite of products designed to teach graphing skills to middle school and early high school students.Graphing Skills Addressed:Identifying when to use a line, bar, or circle graph based on dataCreating line graphsCreating bar graphsCreating circle graphsDrawing lines of best fitInterpreting graphs (positive, negative, and no correlation)Bundle Contents:PPT - Graphing Skills (WITH SUMMARY NOTES)Worksheet - How to Create Line, Bar and Circle Gr
Subjects:
Grades:
7th - 9th
CCSS:
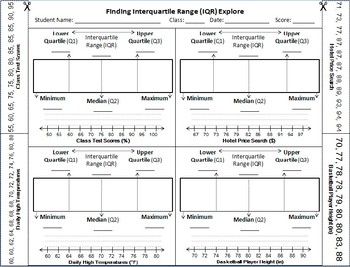
Finding and Comparing Interquartile Range (IQR)
This activity is designed for Texas TEKS listed below. Students use strips of data to fold into 'quartiles' and calculate the IQR.
represent numeric data graphically, including dot plots, stem-and-leaf plots, histograms, and box plots.[6.12A]
interpret numeric data summarized in dot plots, stem-and-leaf plots, histograms, and box plots.[6.13A]
compare two groups of numeric data using comparative dot plots or box plots by comparing their shapes, centers, and spreads.[7.12A]
Subjects:
Grades:
6th - 8th
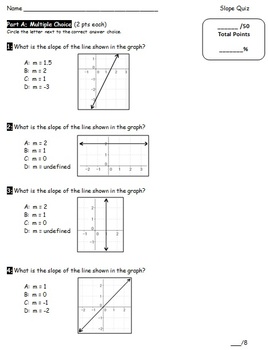
Editable Slope Quiz
This quiz covers finding slope from graphs, from tables, from sets of coordinate pairs and solving for y to make y=mx+b equations through a series of multiple choice and short answer questions. This quiz is editable and an answer key is is included.Related products:Slope Sorting ActivitySlope Puzzle Match
Subjects:
Grades:
8th - 9th
Types:
CCSS:
Also included in: SLOPE mini-bundle
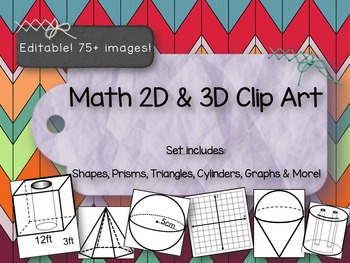
Clip Art Shapes -2D & 3D Prisms, Graphs, Cylinders and more! PPT File
One of the teachers at my school was having trouble finding some 3D geometric shapes to make her test with, so I made a few for her. Then one thing led to another, and now I have a whole bunch of clip art that I thought a Math teacher might find useful. I have used these images to create tests, task cards, scavenger hunts, and practice work for Math small group and centers.
This file is not meant to be used as a presentation. The idea is that you can copy/paste whatever you need from here a
Subjects:
Grades:
5th - 10th
Translation, Reflection, Rotation and Cartesian Plane Test
This Translation, Reflection, Rotation, and Cartesian Plane Test can be used as a quiz, test, assignment, or formative assessment to assess your students' understanding of the Cartesian plane and Transformations. How you use this editable document (WORD file) will depend on your grade level, outcomes, learning goals, and students. Various outcomes are addressed including:-label the x and y axes and origin of a Cartesian plane-identify points on a Cartesian plane -plot points on a Cartesian plane
Subjects:
Grades:
6th - 9th
Types:
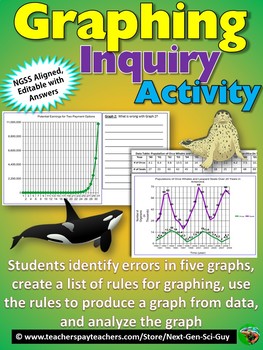
Graphing Inquiry Activity: NGSS Graphing and Data Analysis: Distance Learning
This activity proceeds as follows:1. Students are given a hypothetical scenario in which they are offered two different payment options for house-sitting a wealthy neighbor's house, and have to fill in a data table by calculating the earnings for each option 2. Students then evaluate five different graphs, each of which incorrectly represents the data in some way. They must find the mistakes.3. Students then generate a list of rules for proper graphing4. Students use their rules, and data on or
Grades:
7th - 12th
Types:
3rd Grade Data
3rd Grade Data: This third grade resource on data includes a PowerPoint on four types of data, a small group project using data, a foldable graphic organizer on data, and a quiz on collecting, organizing, displaying and interpreting data for Third Grade TEKS 3.8A and 3.8B: This bundle of resources is closely aligned to the Texas Math Standards TEKS 3.8A and 3.8B. The 30 slide PowerPoint presentation introduces word problems related to everyday life. It includes problems with bar graphs, pict
Subjects:
Grades:
3rd
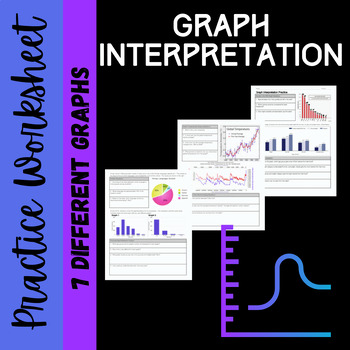
Graph Interpretation Practice
I created this worksheet as a review for students entering my science classes after a long summer of taking selfies. It also helps me assess their incoming knowledge and determine if they need more practice. Students are asked to analyze and interpret data for 7 graphs (line, bar and pie). I have uploaded this in a .docx format so you can modify and differentiate the questions to meet your students' and classroom needs. ANSWER KEY IS INCLUDED. Enjoy!
Subjects:
Grades:
8th - 12th
Types:
Also included in: Science Basic Principles Review Bundle
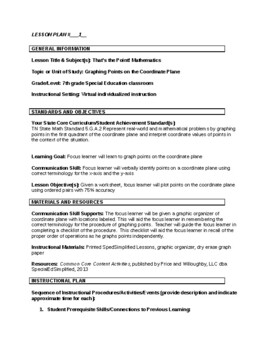
SPED edTpa Task 1 Part B Lesson Plans passed in 2021
Task 1 Part B of SPED edTpa which passed with a 54 in April 2021.Subject was Math for a 7th grader who performs at 5th grade level.This is for use as a study resource or model for edTpa completion. Copying any portion of this is against edTpa rules.
Grades:
5th - 7th
Types:
CCSS:
Analyze the Graphs in Spanish
Here are some good graphs to start the students on graphing. It’s a good practice for them to develop their graphing abilities that are measured in the standardized test (STAAR in Texas). These are for your students to review to get them ready for the test.
Print them in card stock, laminate and cut. Use them as it fits your students and your classroom environment. Obviously, they can be used for partner’s practice, math center, and or whole group. You can display these as flash cards
Subjects:
Grades:
3rd - 4th
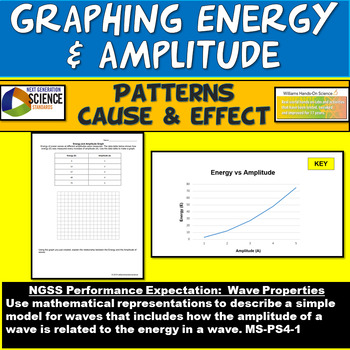
NGSS MS-PS4-1 Graphing Energy & Amplitude Worksheet & PowerPoint
If you are teaching your students how to understand graphs and how the amplitude of a wave is related to the energy in a wave (NGSS Performance Expectation MS-PS4-1), this resource is a great scaffold or assessment! Students discover that as the amplitude of a wave increases the energy increases exponentially, meaning that a small increase in amplitude causes a larger increase in energy. This resource is great as a warm up/bell ringer, homework or sub plan.Take a look at these two graphing waves
Subjects:
Grades:
6th - 12th
NGSS:
MS-PS4-1
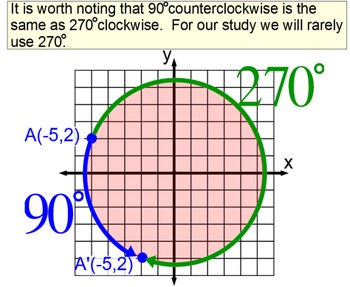
Rotations, Reflections, Dilations & Translations in Geometry for Power Point
Update: I added two assignments that available at Teacher Made. Below are the links to these assignments from the students perspective:Transformations Assignment 1ATransformations Assignment 1BIncluded in this zip folder are 32 Power Point files. 8 files are lessons, 22 are assessment/assignments,1 is a student reference sheet and 1 is a summataive assessment. A brief description of each file:Lesson #1 is a 38 slide file. This lesson is over 90 degree counterclockwise rotations of points and
Subjects:
Grades:
8th - 11th
Also included in: Tom Wingo Geometry Bundle For Power Point

Linear Vs Exponential Functions Walk Around or Gallery Walk with a Riddle
This walk around activity is amazing. It keeps ALL students engaged, having fun, while being assessed all at the same time. Students start at any problem and locate the answer on another page which includes a letter which will spell out a riddle at the end. Check out the preview page and how it leads you to the next problem. Don’t worry, detailed instructions are provided.
Out of all the activities I do in the classroom, this is my favorite thing to do. My students get excited when they
Grades:
8th - 12th
Types:
Also included in: Algebra I Math Bundle of Walk Arounds or Gallery Walks with Riddles
Piecewise-Defined Functions (Algebra 1 - Unit 6) | Bundle for Common Core
This is a great unit that covers a Piecewise-Defined Functions unit in an Algebra 1 course! 5 lessons are included!Documents are EDITABLE!Included:- Overview of the common core alignment (PDF)- Guided notes for 5 lessons (PDF and Word)- PowerPoints that coordinate with the guided notes (PPTX)- Mid-Unit Quiz (PDF and Word)- Unit Test (PDF and Word)- Pacing Guide (PDF and Word)Each lesson contains a learning scale, warm up (do-now or bell ringer), key concepts, vocabulary, and examples for student
Grades:
7th - 12th
CCSS:
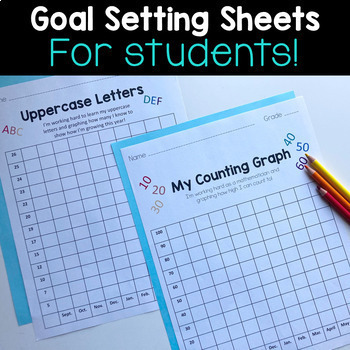
Student Goal Setting Sheets - EDITABLE Blank Student Data Tracking Sheets
Student goal setting sheets are the perfect way to hold your kids accountable for their learning! These editable tracking worksheets are perfect for monitoring your kids' growth including graphing letter sounds, uppercase letters, lowercase letters, counting to 100, words per minute, and more! Multiple cover options are also included, and the best part is everything is editable!You can completely customize these data sheets for your students so you (or they) can track goal progress!Use these EDI
Subjects:
Grades:
K - 2nd
Types:
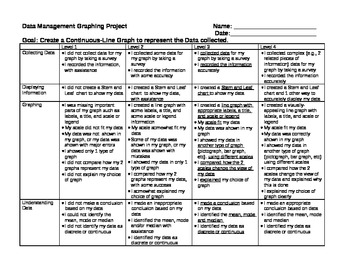
Grade 6 Graphing Project Rubric - Ontario
This is a rubric for a graphing project based on the Grade 6 Ontario Curriculum. It covers all points from the Grade 6 Data Management related to graphing (not probability), EXCEPT - determining how well the data represents a bigger population.
Download the preview to see a sample that one of my students made.
The project I did with my class was:
-collect data by doing a sample, research or experiment
-create a tally chart, stem and leaf plot, and t-chart showing the data
-create a continuou
Grades:
6th
Types:
6th Grade Dimensions Math by Singapore: Chapter 10 Test
This test covers the following concepts:-Locating points on a coordinate plane-Identifying the four quadrants of a coordinate plane-Writing ordered pairs for points on a coordinate plane-Plotting points on the coordinate plane-Finding the distance between points on a coordinate plane-Finding the perimeter and area of shapes created on a coordinate plane-Identifying independent and dependent variables-Creating tables for real-world problems given an equation or graph-Writing equations for real-wo
Grades:
6th
Types:
Also included in: 6th Grade Singapore Math Test Bundle
Showing 1-24 of 1,076 results


