74 results
Graphing poster microsofts
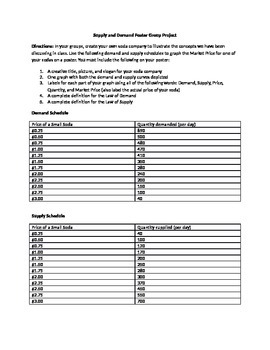
Supply and Demand Poster Group Project
I use this lesson as a summative authentic assessment for the Economic concepts of the Laws of Supply and Demand, Supply and Demand Curves, and Market Price (Equilibrium).
I divide my students into groups of 3-4 and have them create their own unique soda, product slogan, and graph the given supply and demand schedules to find the Market Price for their new soda.
This lesson requires poster paper, markers/colored pencils, and rulers and will take about an hour to complete.
This lesson inclu
Subjects:
Grades:
9th - 12th
Types:
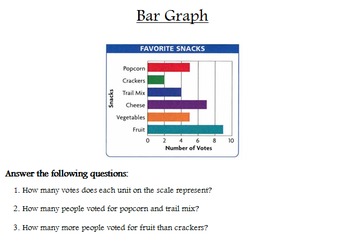
Interpreting Graphs Posters (Line Plot, Bar Graph, Line Graph, Etc)
Students practice interpreting several types of different graphs including line plot, bar graph, line graph, pictograph, double line graph, histogram, circle graph, and stem-and-leaf plot. Poster size sheets, so you can have students rotate in small groups or use in a math center. Answer key is included. I have a free graphic organizer that you can download that will help students learn about the different types of graphs first. Check it out!
Grades:
3rd - 7th
Types:
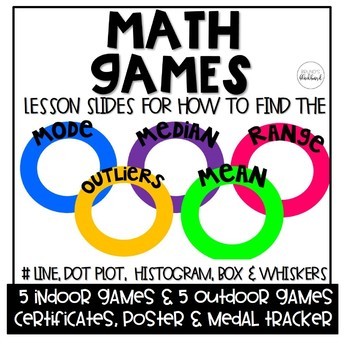
Math Games: Mean, Median, Range, Outliers & Graphs
Math Games
Students will learn how to find the mean, median, mode, range, range playing Olympic style games while practicing and creating Number Lines, Box Plot, Histograms and Box and Whiskers graphs.
This product is a zip file that contains a PowerPoint teaching how to find the mean, median, mode, range, outliers, number plot, dot plot, histogram, box and whiskers, 10 games and an editable create your own game. As well, a PDF file which has posters, awards and placing ribbons. Plus, 2 folda
Subjects:
Grades:
Not Grade Specific
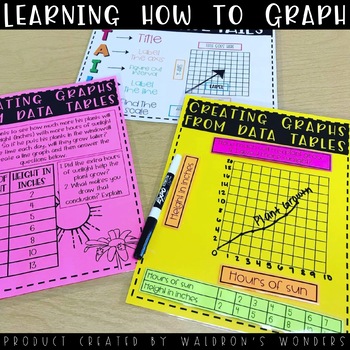
Learning How to Graph
In this product you will find:-How to graph power point to go over the TAILS graphing procedure-Printable 8.5x11 posters for the students to use as a reference to use TAILS-A cut out of TAILS for their interactive notebooks-Creating graphs from word problems and data tables practice (6 different full page printables)-Creating graphs from data tables printables manipulatives (cut and glue/velcro/magnets etc. See product pictures for how I made them with Velcro!-Independent practice (could be a qu
Subjects:
Grades:
4th - 12th
Types:
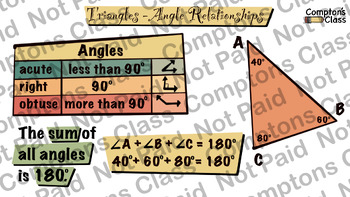
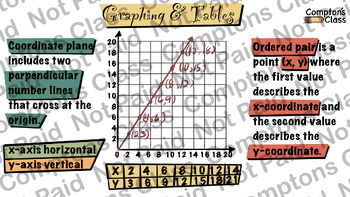
Compton's Class Algebraic Representations 6th Grade Math Package
4 Anchor Charts that deals with Algebraic Representations.
Grades:
6th
CCSS:
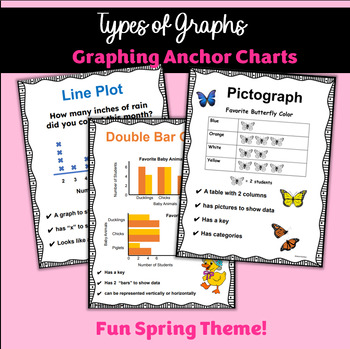
Types of Graphs: Anchor Charts & Graph Visuals for Math Wall Center Printables
This fun spring theme graph instant download printable resource on different types of graphs includes seven 8.5 x 11 anchor charts with minimal clip arts to focus on the specifics of the graphs. Each page has a title, definitions, and examples of each type of graph with fun spring graphs with a spring theme. Print and post these graph visuals to help students remember or refer back to, the different types of graph. Put them on your math word wall, math vocabulary wall, or at math centers and sta
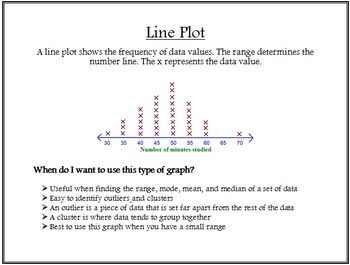
Types of Graphs Posters
Students will explore a variety of different types of graphs and learn about the characteristics and advantageous traits of each type. These posters include the following types of graphs: bar graph, line graph, pictograph, circle graph, line plot, histogram, stem-and-leaf plot, and double line graph. You can display these posters in your classroom for student reference. You can also download my free product named "Types of Graphs Graphic Organizer" and use the posters to help students explore th
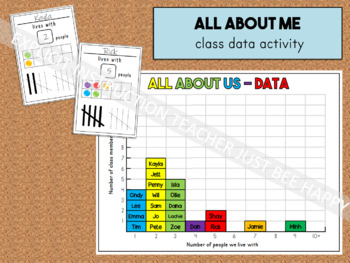
Maths All About Me Whole Class Data Activity Graphing Start of the Year
Fun start of the year Maths activity for Pre-Primary to Year 2 students (Australia)Editable PowerPoint filesMini-sheets are 4 to a page (A4)Class graph sheet is A3Free fonts embedded in files:-Henchgirl comic-The Bold Font-Primer Print
Grades:
PreK - 2nd

Graphing & Data Analysis Disney 4 Park Challenge
Students will practice graphing multiple sets of data using real time data of Disney park wait times. Student scenario: Your group is doing the 4 parks in one day challenge which means park hopping all 4 Disney Parks in one day! You will need to decide on one ride from each of the 4 parks you’d like to ride most and create a poster graphing the hourly wait times comparing the 4 rides so you can map out your day strategically. Students are also given information about the fast pass prices and wil
Subjects:
Grades:
6th - 10th
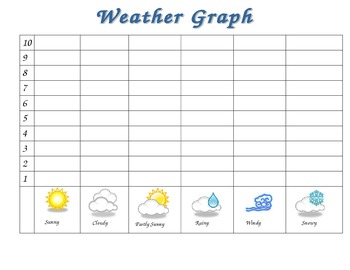
Weather Graph and Tally Chart
Perfect for checking weather in the morning with your class! You can use this as a whole class or individually.
Included are:
1 Weather Graph Recording Sheet
1 Weather Tally Recording Sheet
Subjects:
Grades:
PreK - 2nd
Types:
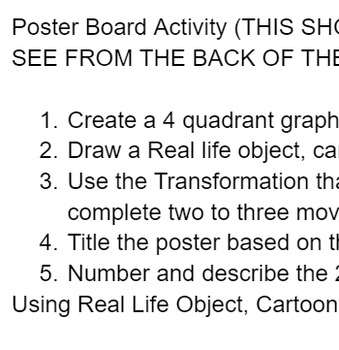
Transformation Poster (Group Acitivity Formative)
This acitivity allows you to assign students Transformations to assess their understanding of The 4 transformation movements> Absolute legend acitivity with my students. I have them present answering the following three promptsDescribe your movement.Decscribe the effec is has on the coordinates.What do we notice about the size and shape of the real-life object?
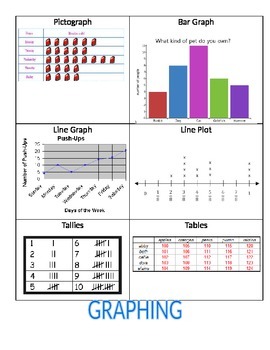
Graphing anchor chart
This small chart will help students remember the types of graphs.
Grades:
3rd - 6th
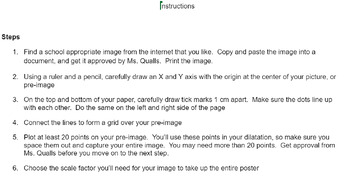
Dilation Character Project
This self directed project is designed specifically for distance learning, but also works well in a classroom setting. Students will need access to two pieces of paper, a ruler, a black marker, and something to color with (crayons, colored, pencils or markers would work!)I do this project with my Geometry students immediately after learning about dilation on the coordinate plane. It is great because it offers a hands on way for students to demonstrate their knowledge, and allows them to expres
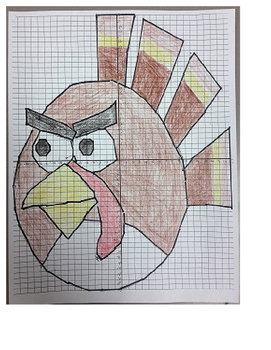
Have a Grumpy Thanksgiving!
This is a fun activity for the sixth, seventh or eighth grade math class or special education classroom that involves a four quadrant coordinate plane. It has some half spaces represented by decimals so this may have to be pre-taught. When finished, feel free to color it however you see fit. Good for the days around Thanksgiving or for homeschooled children.
Subjects:
Grades:
6th - 8th
CCSS:
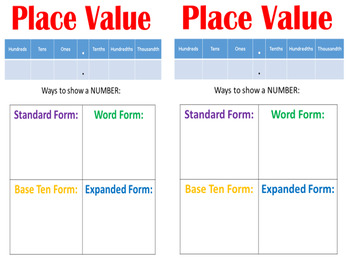
5th Grade Interactive Math Anchor Charts
I created this product because I was really bad at doing Math anchor charts in my class because I am OCD and don't like to put messing things on my classroom walls. I created this to help me guide my students to understand all of the TEKS they need for the STAAR. However, this can also be used for Common Core.
Within this product is a PowerPoint of Interactive Slides of the anchor charts. Another PowerPoint with slides that have the answers so you can turn into posters if your school has a pos
Subjects:
Grades:
3rd - 6th
Common Core Math - Measurement and Data for First Grade
Common Core Math Standards - Measurement and Data
Colorful Student Practice Pages aligned to the common core.
Each page has an "I can" statement and the math standard being covered. Two practice pages for each standard.
"I Can" Statements to laminate and hang in the classroom.
This packet is also available in the bundle of practice pages with all standards.
Created by Catdogteaches
Subjects:
Grades:
K - 2nd
Types:
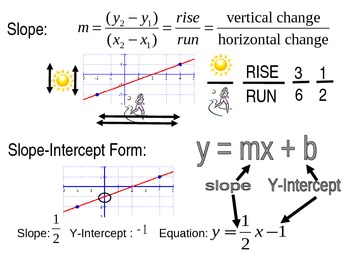
Slope, Intercept, Equation Poster
Print this poster and enlarge it to help your students with Slope, Intercept, and Equations. Graphics make it easy for students to remember to use Rise over Run to find slope.
Grades:
6th - 9th, Adult Education
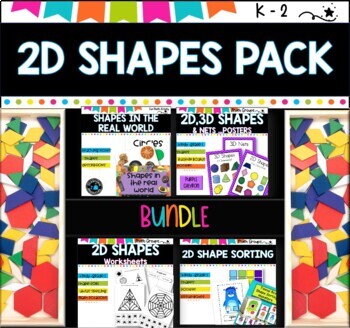
2D Shapes BUNDLE I Worksheets I Shape sorting I Posters
⭐2D Comprehensive bundle- worksheets, game, photos for picture talks, and Posters⭐This bundle has so many fantastic engaging worksheets and activities for you✅2D Shapes are made into a fun activity using the Tissue box monsters for sorting pattern blocks. Easy to make out of old tissue boxes, making them inexpensive to create.✅Shape PostersThis bundle is packed with fun, engaging activities that will teach your preschool, pre-k, or kindergarten students the basic shapes and their characteristics
Grades:
PreK - 1st
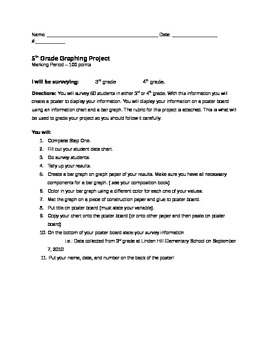
Graphing and Surveying Project
A graphing and Surveying Project for students to get a better idea of how to create different types of graphs. I have used this with fourth and fifth grades and it was fantastic!
The attachment includes: Step by Step directions for the project, a brainstorming sheet, a chart to take the survey on, a written response sheet, and a rubric to grade students.
Graphing and Surveying Project is licensed under a Creative Commons Attribution 3.0 United States License.
Subjects:
Grades:
3rd - 6th
Types:
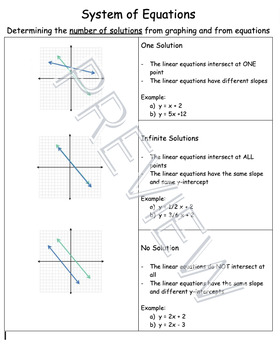
Systems of Equations | Reference Sheet
Reference sheet for students to use when completing systems of equations problems.
Subjects:
Grades:
7th - 10th

Easy Math Classroom Assessment Tracker - Excel Bar Graph Formulas Pre-Loaded
This Excel file includes classroom Math proficiency trackers for schools with Pre-Tests, two or three Benchmark Assessments, and a Post-Test compared to district averages. I've also included a how-to tab and a completed example.
The file defaults to a Galileo Achievement tracker... but it is easy to edit the text if your school conducts other standardized assessments.
In just two easy steps you'll have a great visual prepared for your students:
Step 1: Enter data in the % Proficient boxes
St
Subjects:
Grades:
1st - 8th
Types:
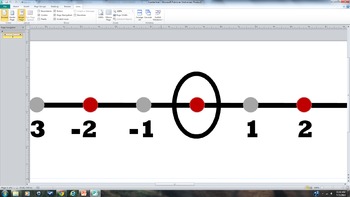
Printable Banner Number Line from -18 to +18 Red, Black and Tan
Printable Banner Number Line from -18 to +18 Red, Black and Tan Print out this Microsoft Publisher File, and you will have your own custom number line! This one is black, red and tan. I made this to fit the decorating needs of my middle school classroom! It will not distract students, but is very visually appealing from anywhere in the room.
Grades:
4th - 12th
Star Light, Star Bright
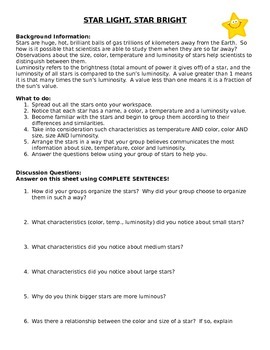
The beginning of this activity was not created by me, but the manipulative extension for it was. In this activity the purpose is for students to categorize the star cards into similar groups. Students may choose to use Color, Luminosity, Magnitude, or Temperature. In the first sheet of the handout there are questions about how and why they grouped the stars the way the did. There are also follow up questions making relationships about all four categories. The second part of the activity has
Subjects:
Grades:
5th - 9th
Types:
Showing 1-24 of 74 results


