19 results
Graphing clip art microsofts
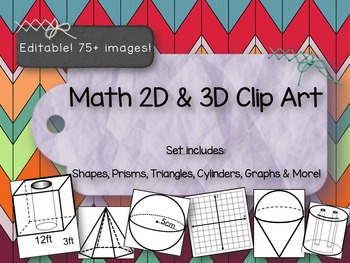
Clip Art Shapes -2D & 3D Prisms, Graphs, Cylinders and more! PPT File
One of the teachers at my school was having trouble finding some 3D geometric shapes to make her test with, so I made a few for her. Then one thing led to another, and now I have a whole bunch of clip art that I thought a Math teacher might find useful. I have used these images to create tests, task cards, scavenger hunts, and practice work for Math small group and centers.
This file is not meant to be used as a presentation. The idea is that you can copy/paste whatever you need from here a
Subjects:
Grades:
5th - 10th
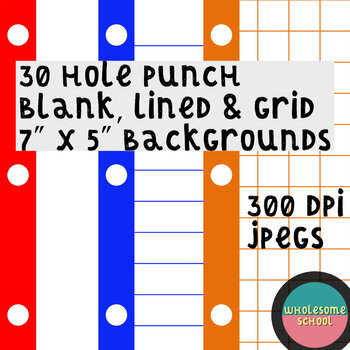
30 JPG Hole Punch Backgrounds | 3 styles (blank, lines, grid) | 10 colors each
In this digital "paper" pack you get a total of 30 JPG files that are 7 inches x 5 inches which are the perfect size/ratio for Boom Cards™! These backgrounds can also be used in Microsoft PowerPoint and Google Slides; you may have to adjust the size of the slides.There are 3 design styles (blank, lines and grid/quad). Colors per each design: black, blue, gray, green, orange, pink, purple, red, teal & yellowThe files are zipped into a single .zip folder so you'll need to be able to unzip the
Grades:
Not Grade Specific
Also included in: BUNDLE of Backgrounds & Borders for BOOM cards, PPT, Slides, etc.
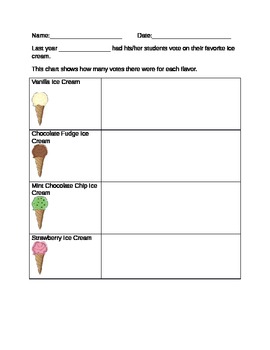
Ice Cream Pictograph Activity
Aimed at second grade students, this activity provides practice for the common core standard: Math Content 2MD. D. 10 - Represent and Interpret Data. Students will use teacher generated tally marks (could be modified for students to make their own tally marks based on a class poll) to create a pictograph using smiley face stickers. Students will gain experience in interpreting tally marks as well as manipulating items in a pictograph to accurately represent data. Teacher can modify tally mark
Grades:
1st - 3rd
Types:
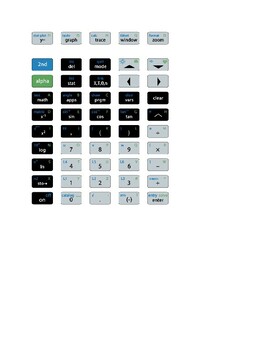
TI-84 Plus CE Graphing Calculator Buttons
A collection of images for putting calculator keystrokes into your handouts. Just copy the image from the file, and paste it into your handout!
Graphing Calculator Buttons Template
Graphing calculator TI 83 buttons created by me for use in mathematics classroom. ( please be aware thumbnail shows buttons as empty, they are not)
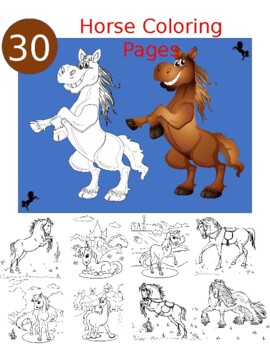
30 Beautiful Pictures of Horses to Color
Unique PPTX For Girls & Boys About Coloring Horses!★ Beautiful designs appropriate for all ages.★ Creativity & self-expression.★ Easily Color with Crayons, Colored Pens.★ Perfect as a combination of learning and having fun at home comfort.★ High-quality vector graphics! ( you can change them ).★ 30 Wide variety and age-appropriate pages to color.These graphics can be used for both personal and commercial use.To not miss any of my new products: Click on the little green star and FOLLOW ME
Subjects:
Grades:
3rd - 12th, Higher Education, Adult Education
Types:
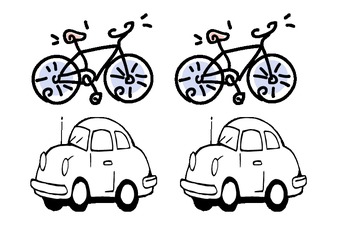
Picture Graph Pics - How the class travels to school
This is just a 4 page resource of pictures I used to introduce picture graphs to my year 1's.
There are four different pics - A bus, a car, a bike and someone walking.
I told the students that we were going to make a picture graph of how our class travels to school. We first made a tally table on the board and then students got the picture that matched their method of transport they take to school and got to colour it in. Once everyone had finished we made a big whole class picture graph.
A
Subjects:
Grades:
K - 2nd
Types:
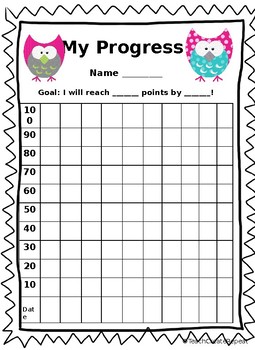
Self-Monitoring Progress Chart
Research shows that students who set goals for themselves and monitor their own progress and more motivated to learn and achieve their goals. These cute charts are a perfect way for students to set goals for themselves and track their own progress. These charts can be glued directly into student folders or used however you wish!
Subjects:
Grades:
1st - 6th
Graph to Cut and Paste - Editable
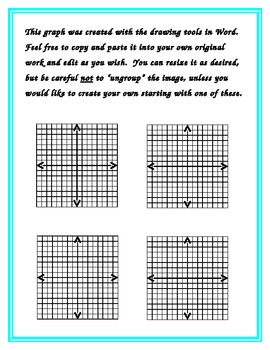
This graph was created with the drawing tools in Word. Feel free to copy and paste it into your own original work and edit as you wish. You can resize it as desired, but be careful not to �ungroup� the image, unless you would like to create your own starting with one of these.
Subjects:
Grades:
6th - 12th
Clip Art Graphs of Parabolas for Cutting, Pasting, and Resizing into Documents
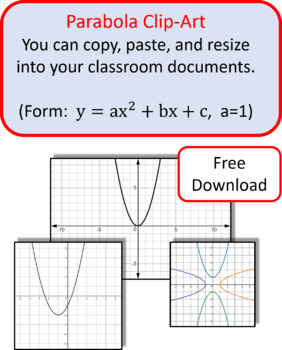
This free PowerPoint document contains the graphs of 27 parabolas that you can cut, paste, and resize for use in your tests, quizzes, homework, or other classroom documents. Not for commercial use. All of the parabolas are of the form y=ax^2+bx+c, where a = 1. The first page of 9 graphs are all y = x^2 set on various scales. The remaining 18 graphs have the vertex along the x-axis and y-axis.
Subjects:
Grades:
8th - 12th, Higher Education, Adult Education
Types:
Blank Normal Curves
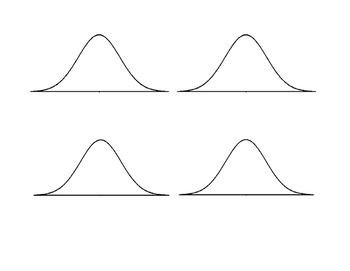
Four normal curves in a landscape MS Word document. Can be copied and pasted to PowerPoint. Click and drag a corner to resize. Click and drag an edge to change depiction of variance.
Subjects:
Grades:
9th - 12th, Higher Education, Adult Education
Clip Art Graphs of Hyperbolas for Cutting, Pasting, and Resizing into Documents
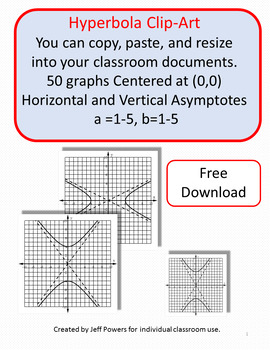
This free PowerPoint document contains the graphs of 50 Hyperbolas that you can cut, paste, and resize for use in your tests, quizzes, homework, or other classroom documents. Not for commercial use. All the graphs are centered at (0, 0). 25 have a horizontal transverse axis and 25 have a vertical transverse axis.
Subjects:
Grades:
8th - 12th, Higher Education, Adult Education
Types:
Clip Art Graphs of Ellipses for Cutting, Pasting, and Resizing into Documents
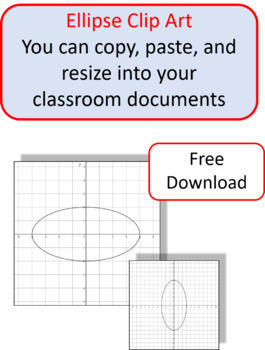
This free PowerPoint document contains the graphs of 10 ellipses that you can cut and paste and resize for for use in your tests, quizzes, homework, or other classroom purpose. Not for commercial use. All of the graphs are centered at (0, 0) and have a horizontal major axis. Length of the major axis ranges from 2 to 10.
Subjects:
Grades:
8th - 12th, Higher Education, Adult Education
Types:
Clip Art Graphs of Circles for Cutting, Pasting, and Resizing into Documents
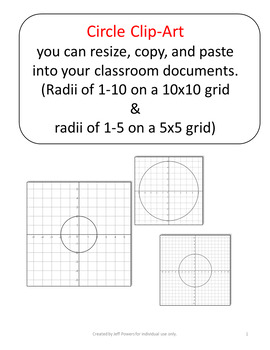
This PowerPoint document contains the graphs of 15 circles that you can cut, paste, and resize for for use in your tests, quizzes, homework, or other classroom purpose. Not for commercial use. All of the graphs are centered at (0, 0). There are ten circles of radii 1-10 displayed on a 10x10 grid and five circles of radii 1-5 displayed on a 5x5 grid.
Subjects:
Grades:
8th - 12th, Higher Education, Adult Education
Types:
Bowling Graphing
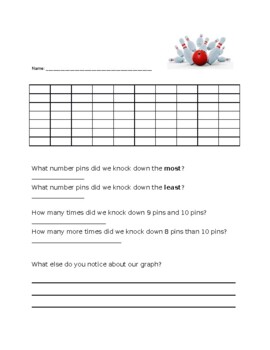
We used a play bowling set to let the students take turns knocking down the pins. They used their information to label the graph and keep track of how many pins they knocked down. Then we answered questions about our information.Enjoy!
Clip Art Graphs of Ellipses for Cutting, Pasting, and Resizing into Documents
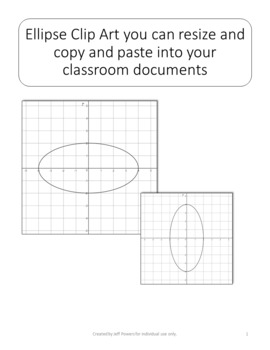
This PowerPoint document contains the graphs of 10 ellipses that you can cut and paste and resize for for use in your tests, quizzes, homework, or other classroom purpose. Not for commercial use. All of the graphs are centered at (0, 0) and have a vertical major axis. Length of the major axis ranges from 2 to 10.
Subjects:
Grades:
9th - 12th, Higher Education, Adult Education
Types:
Clip Art Graphs of Ellipses for Cutting, Pasting, and Resizing into Documents
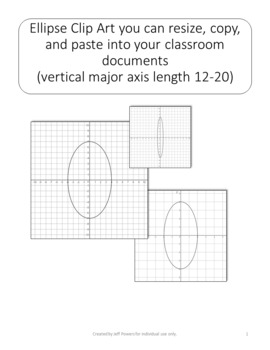
This PowerPoint document contains the graphs of 35 ellipses that you can cut, paste, and resize for for use in your tests, quizzes, homework, or other classroom purpose. Not for commercial use. All of the graphs are centered at (0, 0) and have a vertical major axis. Length of the major axis ranges from 12 to 20.
Subjects:
Grades:
9th - 12th, Higher Education, Adult Education
Types:
Graph pictures for Days of the week
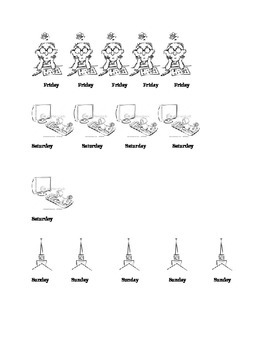
This is just some pictures to copy and create days of the week graphs. It is not a graph.
Showing 1-19 of 19 results


