TPT
Total:
$0.00

Thanksgiving Math: Linear Equation Thanksgiving Dinner Project for Algebra 1

Rated 4.91 out of 5, based on 14 reviews
4.9 (14 ratings)
;
Grade Levels
7th - 10th
Resource Type
Standards
Formats Included
  • Word Document File
Pages
2 pages
$3.00
$3.00
Share this resource
Report this resource to TPT

Description

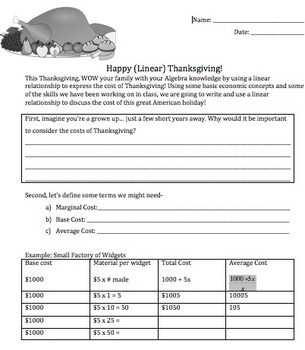
Harnessing the energy my students come in with right before break, I have created a one-period project in which they are going to create a linear equation related to a Thanksgiving meal. It is sometimes hard for students to create their own equations, but I am hoping that this scaffolded project will be something we can reference for the rest of our linear equations unit!

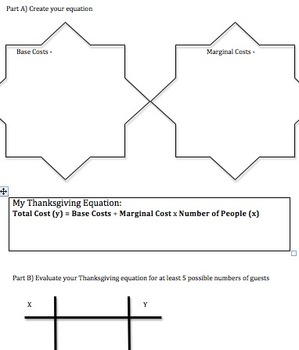
The assignment sheet takes students through some quick new vocab related to economics (definitions included) and provides a basic framework for the equation they will create. On the back, there are two bubbles in which students can brainstorm base costs and marginal costs before creating their equation.

Next, students need to use a chart to find output for 5 different number of guests. I have my students graph these five points on a seperate sheet of graph paper!

Total Pages
2 pages
Answer Key
Included
Teaching Duration
50 minutes
Report this resource to TPT
Reported resources will be reviewed by our team. Report this resource to let us know if this resource violates TPT’s content guidelines.

Standards

to see state-specific standards (only available in the US).
Create equations in two or more variables to represent relationships between quantities; graph equations on coordinate axes with labels and scales.
Explain why the 𝘹-coordinates of the points where the graphs of the equations 𝘺 = 𝘧(𝘹) and 𝘺 = 𝑔(𝘹) intersect are the solutions of the equation 𝘧(𝘹) = 𝑔(𝘹); find the solutions approximately, e.g., using technology to graph the functions, make tables of values, or find successive approximations. Include cases where 𝘧(𝘹) and/or 𝑔(𝘹) are linear, polynomial, rational, absolute value, exponential, and logarithmic functions.
For a function that models a relationship between two quantities, interpret key features of graphs and tables in terms of the quantities, and sketch graphs showing key features given a verbal description of the relationship.

Reviews

Questions & Answers