33 results
Algebra 2 laboratory microsofts
Solving Systems of Equations by Substitution Station Rotation
A Hands-On Approach to Solving Systems of Equations by Substitution. This activity helps students to really understand the substitution method by having them physically replace a variable with its equivalent value.
Subjects:
Grades:
8th - 10th
Types:
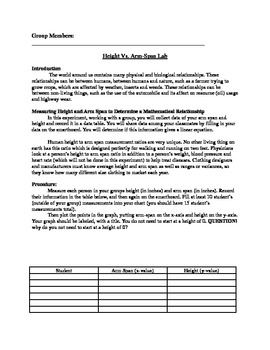
Height Vs. Arm Span Lab: Using real life data and linear regression
Students use their arm-span and heights to create a scatter plot and linear regression to find the equation for a line.
Subjects:
Grades:
8th - 12th
Types:
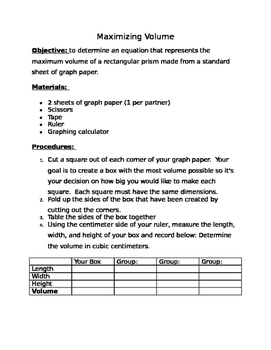
Maximizing Volume: Cubic Functions (popcorn lab)
Student will create boxes from graph paper. Their goal is to make a bog with the biggest volume possible. They will then determine an equation representing the volume of a box. They'll use a graphing calculator to determine the maximum volume and height of the box as well as the domain and range. at the end of the activity they will determine how many pieces of popcorn could fit in their box. the teacher will then give them popcorn to snack on. This activity is a HIT! especially with those
Subjects:
Grades:
10th - 12th
Types:
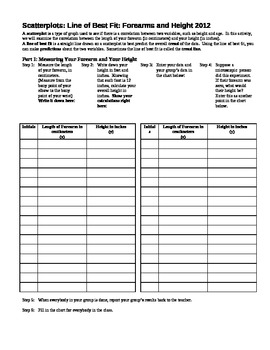
Scatterplots: Linear Regression Line of Best Fit:Forearms and Height (Editable)
After teaching my students about scatterplots, correlation, and the line of best fit, I take a day for them to do a hands-on lab, in which they measure their height (in inches) and their forearm length (from the tip of their elbow, to the bony point on their wrist), and we plot the class data, write the equation of the line of best fit, and then use the equation generated both forwards and backwards. They will need 45 minutes to an hour to do this in class.
Some years, the data have very littl
Subjects:
Grades:
7th - 12th
Types:
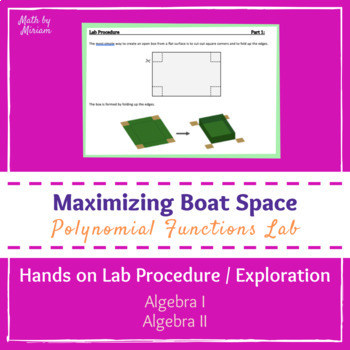
Introduction to Polynomials Functions Lab (PBL PrBL Activity)
This lab is meant to launch your Polynomials unit in an Algebra 2 class or an Honors Algebra 1 class. This is a perfect addition to any PrBL/PBL run class. Before teaching students anything, let them explore an application for a polynomial (cubic) function and derive a function themselves. The pre-lab directs students to build an open-face-box out of a single piece of paper with the largest volume possible in any way they choose (do not give them any further directions!). At the end of the pre-l
Subjects:
Grades:
9th - 11th
Types:
CCSS:
Also included in: Polynomial Functions Resource Bundle (PrBL PBL Unit)
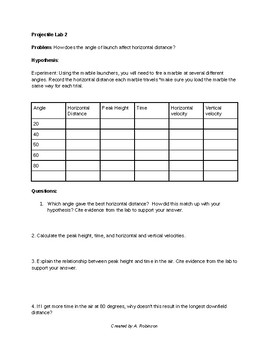
Angled Projectile Lab
This is a lab assignment I created for projectiles launched at different angles. Students will compare the horizontal distances, time in the air, and height achieved by the marble at different launch angles. They will need to do some calculation, and answer conclusion questions at the end.
Subjects:
Grades:
11th - 12th
Types:
NGSS:
HS-ETS1-2
, HS-PS3-2
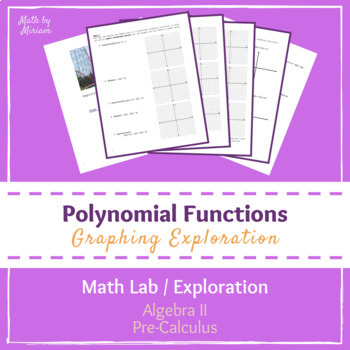
Polynomial Functions Exploration (PrBL PBL Activity)
This lab is designed to 1) introduce the relationship between a function rule, written in intercept form, and the zeros on a graph for all polynomial functions & introduce the concept of end behavior 2) allow students an opportunity to review multiplying polynomials and plotting coordinates precisely by hand. My students were lacking a strong Algebra 2 foundation so I designed this lab for them to raise them up to Pre-Calculus concepts (polynomial behaviors based on the way the function rule
Subjects:
Grades:
9th - 12th
Types:
CCSS:
Also included in: Polynomial Functions Resource Bundle (PrBL PBL Unit)
Math Lab:Exponential Functions and Seed Overproduction vs Time/DISTANCE LEARNING
My students totally enjoy doing the following math lab! They invariably find it to be both fun to do as well as informative. They readily relate to discussions within.
* Students work with a partner
* Students begin by a brief discussion about seed overproduction
* Students are provided with assumptions used to complete the lab
* Students work collaboratively to determine the number of seeds in a bell pepper
* Students find the average number of seeds in a bell pepper using the totals
Subjects:
Grades:
7th - 11th, Higher Education, Adult Education
Types:
My First Car - The Algebra of Personal Finance
This real world activity will help students determine what they can afford when looking into buying their first car. Using the amortization formula, students will determine how much they can borrow as a loan. Additionally students will learn about the interest they have to pay on a loan, and will determine ways to reduce the amount of interest they will pay over the life of a loan.
Subjects:
Grades:
10th - 12th
Types:
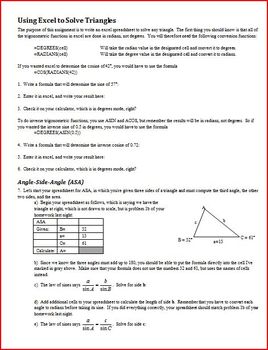
Solving Triangles using Excel (Editable)
I think that when we use technology in the classroom with our students, we should teach them to use technology as a tool. One of the best applications for using a spreadsheet in class is in the solution of triangles. After my students have mastered the laws of sines and cosines with handheld calculators, and are familiar with the ambiguous case, I have them redo the same problems using excel.
It is a very challenging activity for them.
NOTE: Your students will need to have access to a comp
Subjects:
Grades:
10th - 12th
Types:
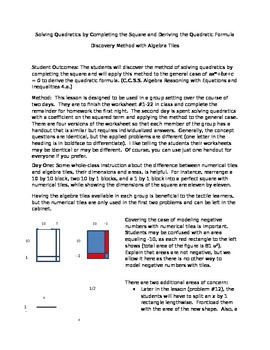
Discover Completing the Square to Solve Quadratics
Build the foundation for deriving the quadratic formula with this two to three day lesson. Then derive the formula. Group activity with four slightly different worksheets, so individual work must also occur.
Grades:
9th - 11th
Types:
CCSS:
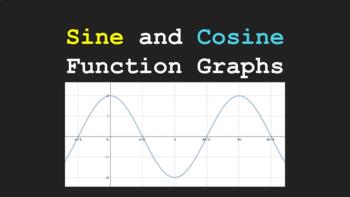
Discovering Sine and Cosine Function Graphs
In this activity, students will use a linked Geogebra to explore the graphs of sine and cosine functions. They will manipulate the amplitude, the period, the phase shift, and the vertical shift parameters to determine how changing those parameters in the function affects its graph. They will reflect on how the algebra of the function relates to its geometry. They will then reflect upon what they have done by coming up with an equation for the period of the functions, exploring the sine/cosine
Subjects:
Grades:
9th - 12th, Higher Education
CCSS:

Modeling Tides with Trig Functions
In this activity, students analyze data sets about water depth through the daily tidal cycle. While completing this activity, students:-- practice computing the parameters of sinusoidal functions and check their work by fitting an equation to the scatterplot-- interpret the meaning of different parameters in context-- determine how a verbal description of changes to the environment would impact parameter values-- introduce a new term to a basic sinusoidal function to incorporate changes in globa
Subjects:
Grades:
9th - 12th
Also included in: Modeling Tides with Trigonometric Functions
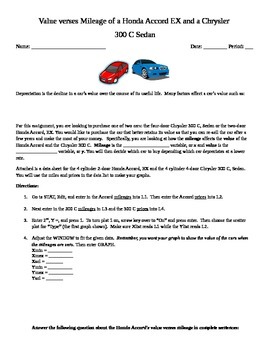
Value verses Mileage of a Honda Accord EX and a Chrysler Systems Problem
In this lesson activity, students explore the value verses mileage of two different cars. The students use linear regression find a line of best fit for the value vs. mileage of each car. The two lines form a system of linear equations. Using their data and equations, students can determine when the values of the cars will be the same and decide which car depreciates at a slower rate.
Subjects:
Grades:
9th - 11th
Types:
CCSS:
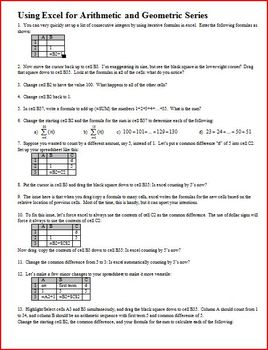
Using Excel for Arithmetic and Geometric Series (Editable)
I think use of technology of the mathematics classroom should be based on tools that people actually use in the real world, and I think that a spreadsheet is one of the most powerful tools I can teach my students to use.
This worksheet is best used right after students have mastered arithmetic and geometric sequences, as it extends what they've done.
I use an earlier activity/worksheet (Introduction to Excel) before I use this one. Once they've gained familiarity with how Excel works, I have
Subjects:
Grades:
10th - 12th
Types:
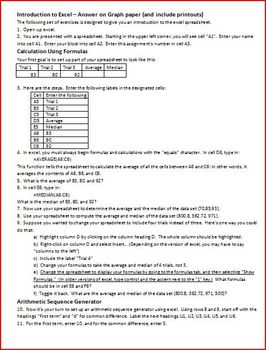
Introduction to Excel - use after arithmetic and geometric sequences (Editable)
I think use of technology of the mathematics classroom should be based on tools that people actually use in the real world, and I think that a spreadsheet is one of the most powerful tools I can teach my students to use.
This worksheet is best used right after students have mastered arithmetic and geometric sequences, as it extends what they've done.
It has them use formulas, the median and average functions, and then it has them write a spreadsheet for the quadratic formula, which is tough fo
Subjects:
Grades:
10th - 12th
Types:
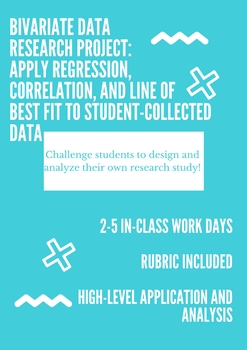
Algebra Research Project
In this bivariate data analysis project, students will develop their own correlation-based study, design a data collection method, and calculate and present on their results. Students will need to have an understanding of data collection, research methods, scatterplots, line of best fit, regression, and correlation analysis to complete this project. In-class work time should minimum be 2 days, max 4, and presentations should take about 2 class days. Since grading happens during presentations, th
Subjects:
Grades:
9th - 12th
Types:
MaLab Complementary and Supplementary Angles from Light Rays/DISTANCE LEARNING
Students have a great time with this lab learning about complementary and supplementary angles as seen through the following activity using light rays!
* Students begin the activity by defining Complementary and Supplementary angles
* Students observe light traveling in straight, parallel lines through the teeth of a comb
* Students learn about angles of incidence and angles of reflection using light, the comb and a mirror.
* Students calculate the complements and supplements to the ang
Subjects:
Grades:
8th - 12th, Higher Education, Adult Education
Types:
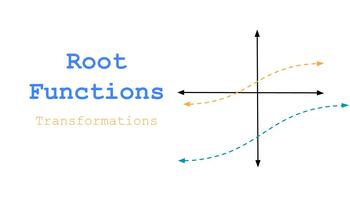
Root Function Discovery in Geogebra
In this activity, students explore transformations on root functions. They determine what happens when the root is odd or even. The determine how to shift and stretch the function vertically or horizontally. Students also look at domain and range for odd and even root functions.
Subjects:
Grades:
9th - 12th
CCSS:

Intro Activity: Interest Rates and Credit Scores
An introduction activity to Interest Rates and Credit Scores.Students will be given fake money that they can buy things with in groups. Each group will have a desk card that tells them how much money they have and a number at the bottom which is their "Credit Score". You know this but they don't know it yet.Students are given a monthly payment plan based on how much they borrowed and their credit scores.Includes:1. Teacher Instructions + Tips2. Desk Cards (1 sided print and 1 per group)3. Items
Subjects:
Grades:
9th - 12th
Types:

Trig Modeling and Pendulum Motion Lab
In this activity, students:-- decompose the motion of a swinging pendulum into horizontal and vertical components-- use right triangle trig to construct pairs of theoretical equations describing the motion of a pendulum with given characteristics (string length, drop angle, etc.)-- use the regression features of desmos.com to compare their theoretical equations to observed data-- use regression analysis to discover which characteristics of a pendulum determine its period (spoiler alert: period i
Subjects:
Grades:
9th - 12th
CCSS:
Also included in: Trig Modeling and Pendulum Motion

Modeling Length of Daylight Hours with Trig Functions
In this activity, students analyze data sets modeling hours of sunlight in three cities over the course of the year (Sydney, Juneau, and Washington D.C.) To complete the activity, students must:-- practice computing the parameters of sinusoidal functions and check their work by fitting an equation to the scatterplot-- use their equations to predict the hours of sunlight on specific days of the year-- use their graphs and equations to predict when pairs of cities will have the same amount of sunl
Subjects:
Grades:
9th - 12th
CCSS:
Also included in: Modeling Seasonal Daylight Length with Trig Functions

Modeling the Business Cycle with Trig Functions
In this lab, students analyze GDP data from five fictional countries. To complete the activity, students:-- create scatterplots of their data using desmos.com/calculator (or other graphing utility)-- use their data sets to compute the parameters of underlying sinusoidal functions and use Desmos to compare their estimates to the data sets-- interpret the parameters of their equations in context by describing how the economies of each country compare and contrast to each other.-- are challenged to
Subjects:
Grades:
9th - 12th
CCSS:
Also included in: Modeling the Business Cycle with Trig Functions: Activity and Data Set

Exponential Functions: Housing Bubble Lab
In this lab, students analyze median home value data from three different cities (Washington DC, Phoenix AZ, and Tampa FL) before and after the recession of the mid-2000's. Students run regressions, use regression equations to make predictions, and interpret the parameters of their regression equations in the context of the housing market.
Subjects:
Grades:
9th - 12th
Types:
CCSS:
Also included in: Exponential Functions: Housing Bubble Lab
Showing 1-24 of 33 results


