Modeling Tides with Trigonometric Functions
The Statistics of the American Dream
5 Followers
Grade Levels
9th - 12th
Subjects
Resource Type
Standards
CCSSHSF-IF.A.1
CCSSHSF-IF.B.4
CCSSHSF-IF.B.5
CCSSHSF-IF.C.7
CCSSHSF-BF.A.1
Formats Included
- Google Docs™
Pages
3 pages
The Statistics of the American Dream
5 Followers

Includes Google Apps™
This bundle contains one or more resources with Google apps (e.g. docs, slides, etc.).
Products in this Bundle (2)
Description
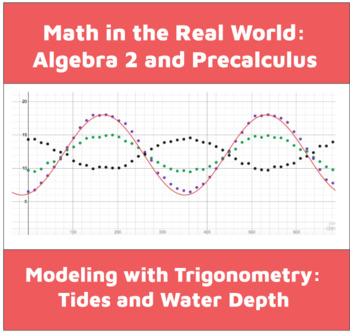
In this activity, students analyze data sets about water depth through the daily tidal cycle. While completing this activity, students:
-- create scatterplots using desmos.com/calculator
-- practice computing the parameters of sinusoidal functions and check their work by fitting an equation to the scatterplot
-- interpret the meaning of different parameters in context
-- determine how a verbal description of changes to the environment would impact parameter values
-- introduce a new term to a basic sinusoidal function to incorporate changes in global water levels
-- draw conclusions about the environmental conditions on a fictional planet based on their estimates
Total Pages
3 pages
Answer Key
Not Included
Teaching Duration
50 minutes
Report this resource to TPT
Reported resources will be reviewed by our team. Report this resource to let us know if this resource violates TPT’s content guidelines.
Standards
to see state-specific standards (only available in the US).
CCSSHSF-IF.A.1
Understand that a function from one set (called the domain) to another set (called the range) assigns to each element of the domain exactly one element of the range. If 𝘧 is a function and 𝘹 is an element of its domain, then 𝘧(𝘹) denotes the output of 𝘧 corresponding to the input 𝘹. The graph of 𝘧 is the graph of the equation 𝘺 = 𝘧(𝘹).
CCSSHSF-IF.B.4
For a function that models a relationship between two quantities, interpret key features of graphs and tables in terms of the quantities, and sketch graphs showing key features given a verbal description of the relationship.
CCSSHSF-IF.B.5
Relate the domain of a function to its graph and, where applicable, to the quantitative relationship it describes. For example, if the function 𝘩(𝘯) gives the number of person-hours it takes to assemble 𝘯 engines in a factory, then the positive integers would be an appropriate domain for the function.
CCSSHSF-IF.C.7
Graph functions expressed symbolically and show key features of the graph, by hand in simple cases and using technology for more complicated cases.
CCSSHSF-BF.A.1
Write a function that describes a relationship between two quantities.


