TPT
Total:
$0.00

Modeling Seasonal Daylight Length with Trig Functions

;
Grade Levels
9th - 12th
Standards
Formats Included
  • Google Docs™
Pages
6 pages
$3.00
List Price:
$4.00
You Save:
$1.00
Bundle
$3.00
List Price:
$4.00
You Save:
$1.00
Bundle
Share this resource
Report this resource to TPT
Includes Google Apps™
This bundle contains one or more resources with Google apps (e.g. docs, slides, etc.).

Products in this Bundle (2)

    Description

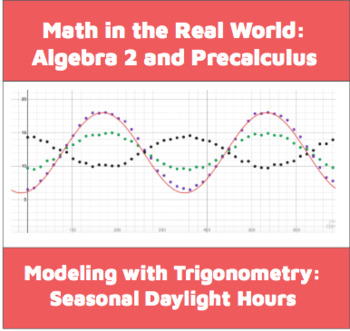
    In this activity, students analyze data sets modeling hours of sunlight in three cities over the course of the year (Sydney, Juneau, and Washington D.C.) To complete the activity, students must:

    -- practice computing the parameters of sinusoidal functions and check their work by fitting an equation to the scatterplot

    -- use their equations to predict the hours of sunlight on specific days of the year

    -- use their graphs and equations to predict when pairs of cities will have the same amount of sunlight

    -- interpret the meaning of different parameters by figuring out how their equations would be impacted by physical changes (e.g. the Earth's orbit around the sun speeds up.)

    The optional extension questions in this activity ask students to imagine a planet in a "figure 8" orbit around a binary star system and to try to create a periodic function that models the hours of daylight on this planet. This is a problem on which students of all levels can make substantial progress, and it can be approached in many ways (right triangle trig, general triangle trig including Law of Sines and Law of Cosines, vectors, or multivariable calculus.) The precisely correct solution is challenging to derive.

    Total Pages
    6 pages
    Answer Key
    Not Included
    Teaching Duration
    50 minutes
    Report this resource to TPT
    Reported resources will be reviewed by our team. Report this resource to let us know if this resource violates TPT’s content guidelines.

    Standards

    to see state-specific standards (only available in the US).
    Understand that a function from one set (called the domain) to another set (called the range) assigns to each element of the domain exactly one element of the range. If 𝘧 is a function and 𝘹 is an element of its domain, then 𝘧(𝘹) denotes the output of 𝘧 corresponding to the input 𝘹. The graph of 𝘧 is the graph of the equation 𝘺 = 𝘧(𝘹).
    Use function notation, evaluate functions for inputs in their domains, and interpret statements that use function notation in terms of a context.
    For a function that models a relationship between two quantities, interpret key features of graphs and tables in terms of the quantities, and sketch graphs showing key features given a verbal description of the relationship.
    Relate the domain of a function to its graph and, where applicable, to the quantitative relationship it describes. For example, if the function 𝘩(𝘯) gives the number of person-hours it takes to assemble 𝘯 engines in a factory, then the positive integers would be an appropriate domain for the function.
    Write a function that describes a relationship between two quantities.

    Reviews

    Questions & Answers