10 results
Algebra 2 laboratories for Google Apps

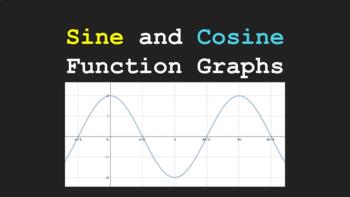
Discovering Sine and Cosine Function Graphs
In this activity, students will use a linked Geogebra to explore the graphs of sine and cosine functions. They will manipulate the amplitude, the period, the phase shift, and the vertical shift parameters to determine how changing those parameters in the function affects its graph. They will reflect on how the algebra of the function relates to its geometry. They will then reflect upon what they have done by coming up with an equation for the period of the functions, exploring the sine/cosine
Subjects:
Grades:
9th - 12th, Higher Education
CCSS:

Modeling Tides with Trig Functions
In this activity, students analyze data sets about water depth through the daily tidal cycle. While completing this activity, students:-- practice computing the parameters of sinusoidal functions and check their work by fitting an equation to the scatterplot-- interpret the meaning of different parameters in context-- determine how a verbal description of changes to the environment would impact parameter values-- introduce a new term to a basic sinusoidal function to incorporate changes in globa
Subjects:
Grades:
9th - 12th
Also included in: Modeling Tides with Trigonometric Functions

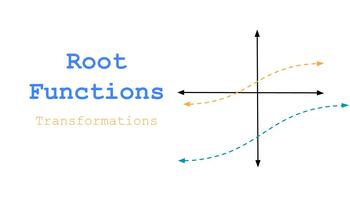
Root Function Discovery in Geogebra
In this activity, students explore transformations on root functions. They determine what happens when the root is odd or even. The determine how to shift and stretch the function vertically or horizontally. Students also look at domain and range for odd and even root functions.
Subjects:
Grades:
9th - 12th
CCSS:

Trig Modeling and Pendulum Motion Lab
In this activity, students:-- decompose the motion of a swinging pendulum into horizontal and vertical components-- use right triangle trig to construct pairs of theoretical equations describing the motion of a pendulum with given characteristics (string length, drop angle, etc.)-- use the regression features of desmos.com to compare their theoretical equations to observed data-- use regression analysis to discover which characteristics of a pendulum determine its period (spoiler alert: period i
Subjects:
Grades:
9th - 12th
CCSS:
Also included in: Trig Modeling and Pendulum Motion

Modeling Length of Daylight Hours with Trig Functions
In this activity, students analyze data sets modeling hours of sunlight in three cities over the course of the year (Sydney, Juneau, and Washington D.C.) To complete the activity, students must:-- practice computing the parameters of sinusoidal functions and check their work by fitting an equation to the scatterplot-- use their equations to predict the hours of sunlight on specific days of the year-- use their graphs and equations to predict when pairs of cities will have the same amount of sunl
Subjects:
Grades:
9th - 12th
CCSS:
Also included in: Modeling Seasonal Daylight Length with Trig Functions

Modeling the Business Cycle with Trig Functions
In this lab, students analyze GDP data from five fictional countries. To complete the activity, students:-- create scatterplots of their data using desmos.com/calculator (or other graphing utility)-- use their data sets to compute the parameters of underlying sinusoidal functions and use Desmos to compare their estimates to the data sets-- interpret the parameters of their equations in context by describing how the economies of each country compare and contrast to each other.-- are challenged to
Subjects:
Grades:
9th - 12th
CCSS:
Also included in: Modeling the Business Cycle with Trig Functions: Activity and Data Set

Exponential Functions: Housing Bubble Lab
In this lab, students analyze median home value data from three different cities (Washington DC, Phoenix AZ, and Tampa FL) before and after the recession of the mid-2000's. Students run regressions, use regression equations to make predictions, and interpret the parameters of their regression equations in the context of the housing market.
Subjects:
Grades:
9th - 12th
Types:
CCSS:
Also included in: Exponential Functions: Housing Bubble Lab

Exponential Function Lab: Ball Bounce Height
When you drop a ball, the height of successive bounces follows an exponential decay relationship. In this lab, students use regression analysis on the provided data set to interpret exponential equations in a real life physical context. The lab includes data for a tennis ball and a soccer ball. After analyzing the data for each ball separately, students are asked to explain how the differences in the parameters of the regression equation correspond to physical properties of the balls.
Subjects:
Grades:
9th - 12th
Types:
CCSS:
Also included in: Exponential Functions: Ball Drop Lab

Projectile Motion Quadratics Lab
In this activity, students analyze two different data sets that describe how projectiles fly through the air. The first describes the flight path of a thrown ball and the second describes the distance traveled by a ball dropped off a building over time. Using desmos.com, students fit linear and quadratic models to discover which quantities are related linearly (time and horizontal distance traveled) and which are related quadratically (time and vertical distance traveled.) They are asked to inte
Subjects:
Grades:
8th - 12th
CCSS:
Also included in: Quadratic Projectile Motion Lab with Data Set

Pendulum Lab Data Set
This is the data set needed to complete the Trig Pendulum Lab.
Subjects:
Grades:
9th - 12th
Also included in: Trig Modeling and Pendulum Motion
Showing 1-10 of 10 results


