13 results
Free algebra 2 laboratories
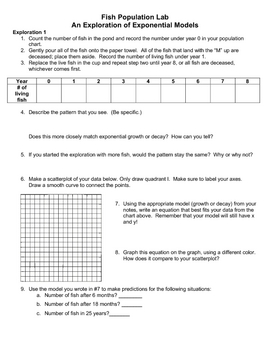
Population Lab: Exponential Growth and Decay
This lab is designed to give students a hands-on introduction to exponential growth and decay functions and their graphs.
Grades:
8th - 10th
Types:
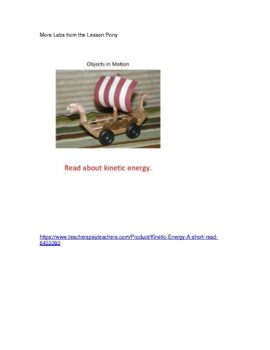
Physics Speed Lab Hot wheels
This is an classic lab which students will learn how to graph speed and motion of their hot wheel cars. It has been updated to the new STEM standards. No prep and your middle school students will be engaged https://www.teacherspayteachers.com/Product/Kinetic-Energy-A-short-read-6433393https://www.teacherspayteachers.com/Product/Newtons-three-laws-of-motion-and-Jingle-Bells-6285698
Subjects:
Grades:
6th - 8th
Types:
NGSS:
MS-ETS1-2
, MS-PS2-2
, MS-PS2-1
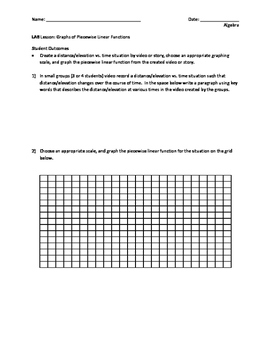
Graphs of Piecewise Linear Functions in the Real World
This activity is a "Lab" series lesson activity designed to supplement and enhance student learning after teacher instruction.
In this "Lab" students work in small groups to video, demonstrate, or create a story that demonstrates distance or elevation versus time. The students will then take this information to create a graph and answer follow up questions based on their scenario and graph.
While this "Lab" can supplement any teacher instruction based on this topic, this "Lab" was developed
Subjects:
Grades:
9th - 11th
Types:
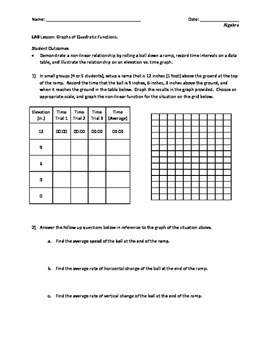
Graphs of Quadratic Functions in the Real World
This activity is a "Lab" series lesson activity designed to supplement and enhance student learning after teacher instruction.
In this "Lab" students work in small groups to experiment with a ball rolling down a ramp. It allows the students to work with a set of data that is believed to be linear, but is really quadratic when graphed on the coordinate plane.
**It is important to note that the teacher will need additional supplies such as a ramp (longer the better), a ball, and a timing de
Subjects:
Grades:
9th - 11th
Types:
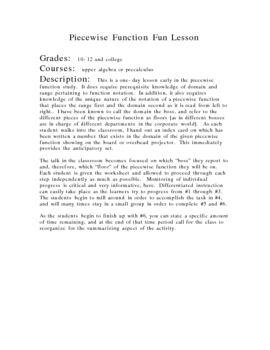
Piecewise Function Fun
This one-day lesson is good for early exploration of the piecewise function and how to obtain the graph of a piecewise function. Concepts such as domain and range and function notation are strengthened or assessed depending upon the learner. It is an activity which leads the learner step-by-step with group work possible and concludes with a whole-class discussion summary.
Subjects:
Grades:
10th - 12th
Types:
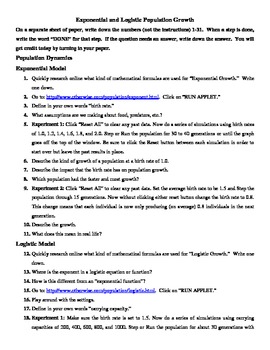
Exponential and Logistic Modeling Internet Project
Using the provided URL, the applet provides a population growth simulation for two scenarios: exponential and logistic. This worksheet presents an orderly way to explore both, taking into account pros and cons for each. May be used for solely exponential modeling, though the logistic modeling helps students judge between different types of mathematical modeling. Worksheet includes a total of 6 "Experiments" to run with the simulation. Can be done in a computer lab in one hour. May be used e
Subjects:
Grades:
9th - 12th
Types:
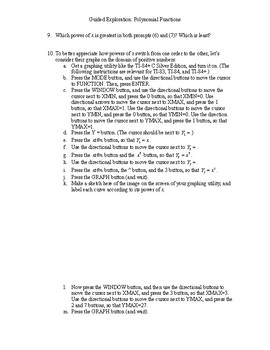
Guided Exploration: Polynomial Functions
42-item teacher-lead inquiry into properties and behavior of Polynomial Functions. Best used at the beginning of a unit on polynomial functions (before demonstrating how to solve textbook problems), this activity invites students to use inductive reasoning and class discussion to discover the big ideas behind graphing polynomial functions without a graphing utility.
Subjects:
Grades:
10th - 12th
Types:
CCSS:
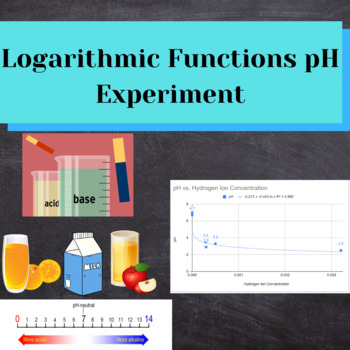
Mathematical-Logical Lesson Plan: Logarithms pH Experiment
This pH experiment is great for the grade 12 logarithmic and exponential functions math unit. The 12th grade math experiment is great for the mathematical-logical multiple intelligence. It shows students the relationship between pH and hydrogen ion concentration through graphing and allows them to test the equation.This experiment can be done with pH strips using the actual drinks, but can also be done through online research. Want activities for all 8 multiple intelligences? Check out the mul
Subjects:
Grades:
11th - 12th
Types:
Also included in: Logarithmic and Exponential Functions: Multiple Intelligences Bundle
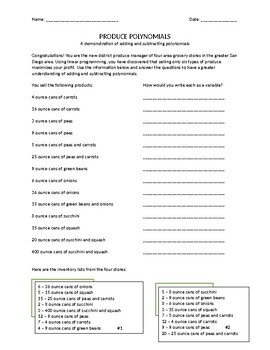
Produce Polynomials
Use a real life application of tracking the inventory of grocery stores to learn the concept of adding and subtracting polynomials. Includes a worksheet and answer key.
Subjects:
Grades:
8th - 12th
Types:
CCSS:
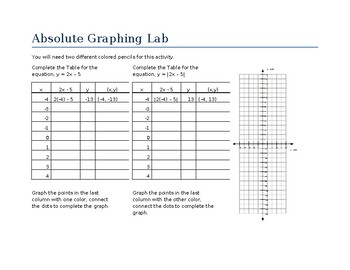
Absolute Value Graphing Lab
In this quick introductory lab, students will develop an understanding about the shape and properties of absolute value graphs by comparing contrasting similar linear and absolute value functions. Key included!
Subjects:
Grades:
7th - 12th
Types:
CCSS:

Electronic Student Grapher
The electronic student grapher is a simple program that can be used to demonstrate graphing linear lines and inequalities. This also can be used to allow students explore and demonstrate their ability to create graphs.
Subjects:
Grades:
7th - 12th
Types:
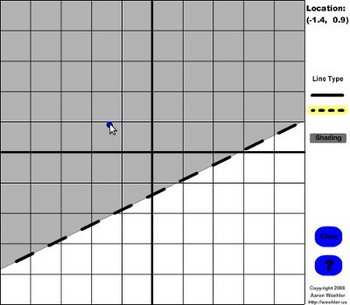
Student Line Grapher
The student line grapher is a simple flash program that can be run locally on your Windows or Mac computer. It allows students to quickly experiment with the information needed to make a line graph or inequality.
Subjects:
Grades:
5th - 11th
Types:
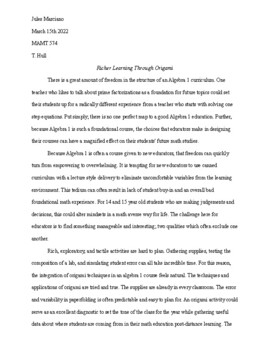
Algebra 1 Origami Intro Day 1
This is my day 1 activity for algebra 1 along with a paper I wrote about it. Enjoy!
Subjects:
Grades:
7th - 10th, Higher Education
Types:
Showing 1-13 of 13 results


