40 results
Elementary graphing laboratory microsofts
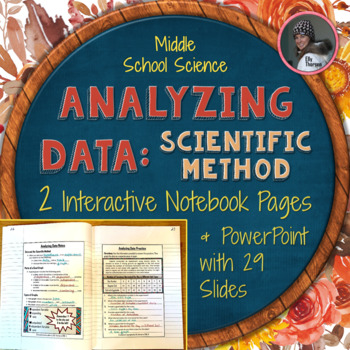
Analyzing Data Interactive Notebook Pages & PowerPoint for the Scientific Method
This middle school science resource has two interactive notebook pages and a 29 slide PowerPoint about analyzing data and making good graphs in the scientific method. The INB pages and PowerPoint emphasize these important graphing concepts:a title that's a combination of the independent and dependent variablesan x-axis label that contains the independent variablea y-axis label that contains the dependent variableaccurate intervals on graphsthe purposes and uses of bar graphs, line graphs, and pi
Subjects:
Grades:
5th - 8th
NGSS:
MS-ETS1-3
Also included in: Scientific Method Interactive Notebook Pages and PowerPoint BUNDLE
bar graph pie graph graphing thermometer lab PowerPoint STEM 3 4 5 6 TX TEKS
This fun, hands-on, lab and graphing activity gets your students thinking deeply and putting their knowledge of graphing, gathering data, and following instructions to the test. Perfect for test prep! Great way to incorporate science, technology, engineering, and math (STEM) concepts into a fun lesson. This lesson was created for elementary and middle school students and is great practice to help students reinforce the concepts of graphing, data gathering, creating bar graphs, creating pie graph
Subjects:
Grades:
3rd - 6th
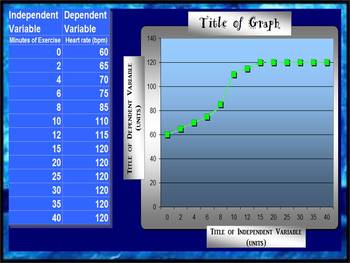
LINE GRAPH MAKER (AUTOMATIC)
This spreadsheet allows you to insert your independent and dependent variables into a chart and voila!... a line graph is generated as you enter in each piece of new data! Students love to take their data from a lab and watch as a graph is made right before their eyes! You can change all of the titles on the chart and the graph to suit your classes laboratory experiment needs! Students can easily print out their data to include in their lab reports!
Grades:
2nd - 12th
Types:
Weather Tracking in Excel
Compatible with Google Sheets, Google Classroom, or as a stand-alone file on a PC, this product is a must have for any teacher comparing weather conditions in multiple locations!
BEFORE YOU BUY: This file is part of a larger unit. Save yourself money by purchasing the Super Science Set for Weather and Climate nstead of buying each file separately.
Purchased alone, you get:
⭐ An Excel workbook that enables students to track the weather for 5 different locations as a whole class or individ
Subjects:
Grades:
4th - 8th
Types:
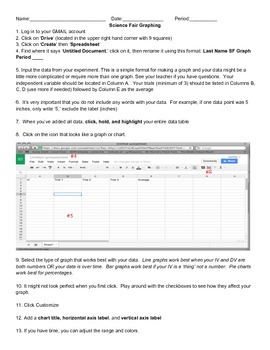
How To Graph Using Google Spreadsheets
This is a step-by-step guide on how to use Google Spreadsheets for students in grades 5-12. Use this as a resource when guiding students through the process. Included with the directions is sample data for students to use when practicing graphing. Perfect for science experiments and science fair!
Subjects:
Grades:
5th - 12th
Types:
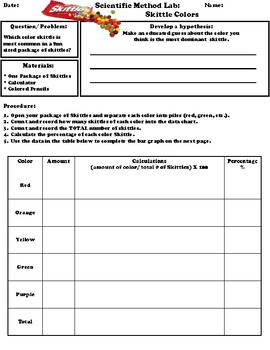
Scientific Method Lab: Skittle Colors (editable and fillable resource)
These skittles labs are a fun and engaging way to have students learn about the scientific method. It 's easy for the student to figure out the lab process.Lab contents:1. Skittle Colors Lab:A. Question: Which color skittle is most common in a fun sized package of skittles?B. Developing a hypothesisC. ProcedureD. Post-Lab Questions
Subjects:
Grades:
3rd - 8th
Types:
Math Lab - Bouncing Balls - measuring, data collecting, variable
This is a math lab called "The Bouncing Ball Lab". It has students measure the bounces from various size balls dropped at certain heights. This is a great lab to do when learning about graphs. The students have to create and make predictions from the graphs. The entire lab packet for students is included in this file.
Subjects:
Grades:
3rd - 6th
Types:
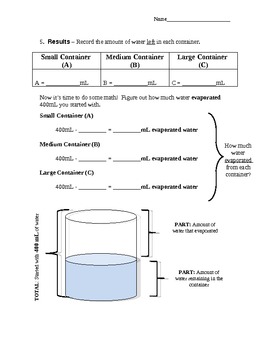
Whole Class Evaporation Science Experiment
Evaporation experiment designed for a whole class. Includes testable question (regarding surface area and evaporation), hypothesis (blank), graphs for data, results/conclusions. A lot of math (graphing ,subtraction, and finding area of rectangular shapes) is involved. Takes at least two days to complete.
Subjects:
Grades:
3rd - 6th
Types:
Graphing Unit
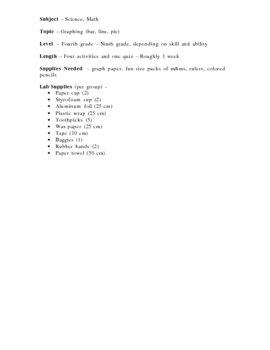
This unit contains 5 separate graphing activities. In the first activity, student create a bar graph of the depths of different oceans and answer follow-up questions. In the second activity, students collect tally colors of m&ms and use this data to create a bar graph and answer questions. In the third activity students create a bar graph of the diameters of the planets and answer related questions. In the fourth activity, the laboratory activity, students record the temperature of hot water
Subjects:
Grades:
3rd - 9th
Types:
BAR GRAPH (AUTOMATIC)
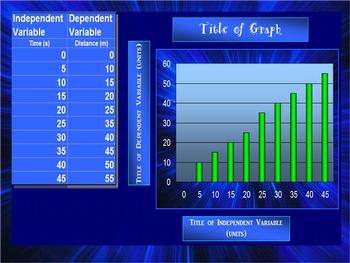
This spreadsheet allows you to insert your independent and dependent variables into a chart and voila!... a bar graph is generated as you enter in each piece of new data! Students love to take their data from a lab and watch as a graph is made right before their eyes! You can change all of the titles on the chart and the graph to suit your classes laboratory experiment needs! Students can easily print out their data to include in their lab reports!
elementary science class, middle school sc
Grades:
2nd - 12th
Types:
Lab PSI CSI - A Deflated Football Science Experiment
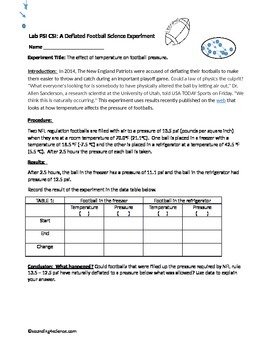
Superbowl Science. Deflategate PSI CSI
What deflated the footballs? Students will examine and analyze real data of the temperature effect on pressure of NFL footballs.
Students who are ready are encouraged to take this further to link the deflation to Charles' law, which explains this property of a gas.
Subjects:
Grades:
5th - 10th
Types:
Creating Line Graphs in science-Basic Step by Step review directions & practice
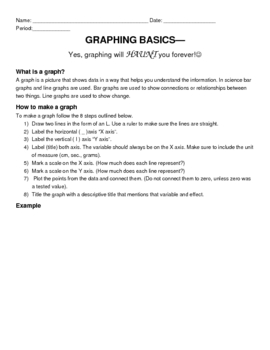
This is a sheet i hand out to my science students for them to keep in the resources section of their binder. It has step by step directions on how to create a line graph. They use it whenever they are required to graph results to an experiment.Challenge students understanding of graphing with this activity where students find problems with already made graphs! Can you find the LINE GRAPHING MISTAKES? 8 Graph Task Cards ApplicationMore graphing activities here:Pendulum Inquiry/Lab -3 experiments,
Subjects:
Grades:
4th - 11th
Types:
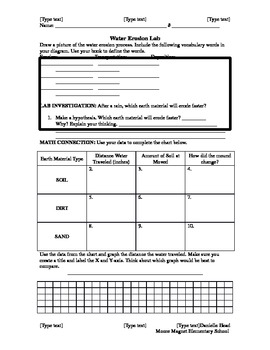
Water Erosion Lab
Students will learn about physical weathering through this water erosion lab. This lab requires them to measure, graph, and write their reflections.
Subjects:
Grades:
3rd - 5th
Types:

Scientific Method Graphing Lab
This lab can be completed with bags of candy, such as Skittles or M&M's. I picked up favor tins from the local craft store and used craft beads (to avoid food allergies). Each tin contains 25 beads of varying colors.
Each student gets a tin and makes a prediction about what color they believe will be most dominant. They then open the tin and sort out the beads. They graph their data and we compile a class data sheet on the board. Students then graph the class data.
This lab not onl
Subjects:
Grades:
5th - 8th
Types:
Kinetic and Potential lab Spring powered vehicles to explore effects of energy
STEM In this fun hands on lab students will discover how spring-powered vehicles effect the varying the amount of kinetic energy. Your middle school students will measure the distance traveled, use graphs to present their data and be able to draw conclusion from the graphs. They will determine the relationship between number of presses or winds and distance traveled. Also your students at the end of this lesson will understand that energy is a property of an object and the quantity of energy
Subjects:
Grades:
4th - 8th
Types:
NGSS:
MS-PS3-5
, MS-PS3-1
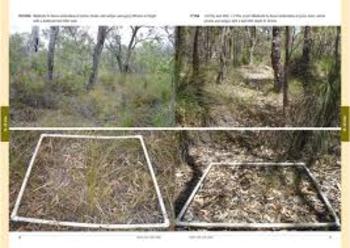
Ecology Lab: Micro-Plot sampling and graphing
Combined with field work (access to a forest is required), students collect data, and then return to class to use the data in two separate graphs. They create a paper-and-pencil graph, and they follow a set of detailed instructions to use their data in order to complete a graph using Microsoft Excel.
Subjects:
Grades:
4th - 6th
Types:
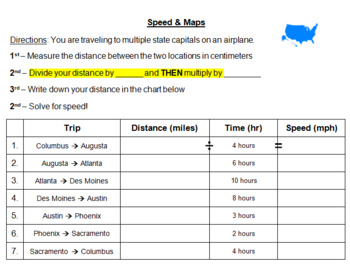
Finding Speed with Maps - OHIO 5TH GRADE SCIENCE
Use any map you want! Students pretend they are flying on a plane to different state capitals. They will measure the distance in cm and then convert to miles based on YOUR map's scale. Students solve for speed & rank each trip based on how fast the plane was moving. Students create a bar graph to show their results!
Subjects:
Grades:
3rd - 8th
Types:
Apple Oxidation Experiment - Editable Version
Apple Oxidation Science ExperimentWhy do apples turn brown?Quench your child's curiosity with this simple and fun experiment.With your purchase you will receive editable and non-editable labels (control apple/ water/ lemon juice/ milk/ oil/ vinegar) as well as editable and non-editable recording charts to list your child's observations over a lapse of 8 days. (starting with Day 0)Do not forget to leave a review so that I may serve you better in the future.Please remember that everytime you leave
Grades:
K - 2nd
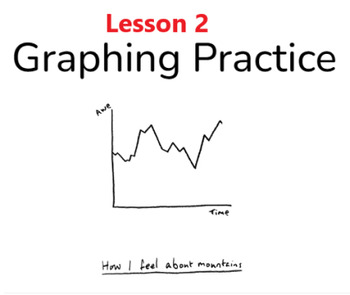
Science/Math - using Nearpod - GRAPHING PRACTICE LESSON 2
Are you looking for a tool that can freely supply a student with all the information needed to teach them with very little or no work from you? Well then this is the resource for you. This tool will prompt students with critical thinking exercises and challenges that address key ideas but supply the explanations as well. This teaching device can be provided to students in a full class forum or can be assigned as independent study. The following lesson is one of many to engage students in the ent
Grades:
5th - 12th, Higher Education
Types:
CCSS:
Graphing Temperatures
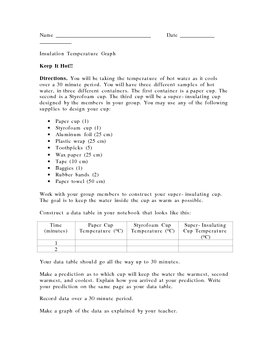
Students record the temperature of warm water in three different cups over a 30 minute period and then construct a line graph of this data. One cup is a paper cup, the second is a styrofoam cup, the third is an insulating cup that the students create.
Subjects:
Grades:
5th - 10th
Types:
Apple Experiment - Scientific Method
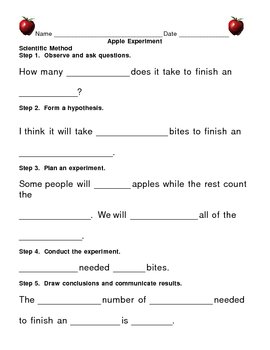
This experiment is used when teaching or reviewing the scientific method. It is designed using apples, but you can substitute different snacks or candy. It also teaches the math skills recording/presenting data and calculating averages. This experiment can be done in groups or independently. I have included teacher instructions, student lab sheet, modified student lab sheet, and sample answer key.
Grades:
3rd - 5th
Types:
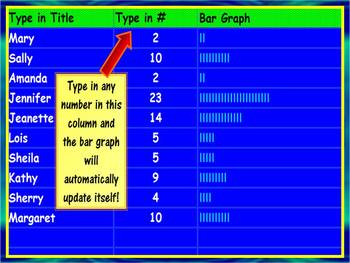
Automatic Bar Graph Maker
This activity can be used to teach students of all ages about bar graphs. This spreadsheet can be used to introduce the concept of bar graphs to elementary students as well as implemeted by mid-level & high school students in lab reports and/or presentations. It is extremely quick and easy to use! Just type in a set of numbers and it automatically creates a simple bar graph. And check out my other graph templates for line and bar graphs! They are definately worth your time!
Grades:
K - 12th
Types:

Bubble Gum LAB
Students will walk through the scientific process, learn about mass and use a triple beam balance while doing a bubble gum activity.
Subjects:
Grades:
2nd - 8th
Types:

Temperature Experiment-- Collecting and Organizing Data
Integrating math and science, the idea behind this experiment is simple. The collection and organization of data is more challenging. This is the "lab packet" for an experiment where students will use water, ice cubes, thermometers and timers. Students will measure the temperature of water at specific time intervals with varying amounts of ice. This is a great stepping stone for learning the scientific method, measurement and data organization. I am posting in Word format so you can make a
Subjects:
Grades:
3rd - 8th
Types:
Showing 1-24 of 40 results


