126 results
12th grade graphing laboratories
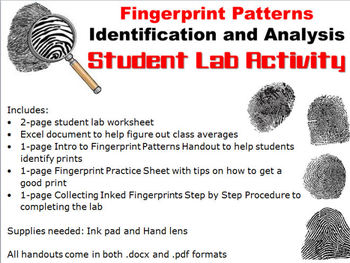
Forensic Science: Fingerprint Patterns Lab Activity
A great lab for any Forensic Science class studying fingerprints! Students learn to take fingerprints, identify fingerprint patterns, and collect class data to compare with national averages. It also helps students practice graphing.
Includes:
• 2-page student worksheet
• Excel document to help figure out class averages
• 1-page Intro to Fingerprint Patterns Handout to help students identify prints
• 1-page Fingerprint Practice Sheet with tips on how to get a good print
• 1-page Collecting Ink
Subjects:
Grades:
8th - 12th
Types:
Also included in: Forensic Science Fingerprints Unit Bundle

Beaker Pong: Experimental Design and Graphing Lab, NGSS aligned
Great 1st week or 1st month STEM activity! All parts are EDITABLE and includes a graphing grid! This is a great way to introduce the "science process" (better phrase for scientific method) at the start of a semester or anytime you want fun to occur in your classroom.*****Focus on the NGSS PRACTICES Dimension*****The National Research Council's (NRC) Framework describes a vision of what it means to be proficient in science; it rests on a view of science as both a body of knowledge and an evidenc
Subjects:
Grades:
7th - 12th
Types:
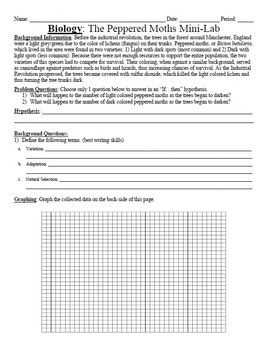
Natural Selection Peppered Moth data analysis
Students will examine data from the historical peppered moth experiment and answer several analysis questions and create a graph of the data. This is a great way to reinforce the concept of natural selection as the population sizes of two Peppered moths increase and decrease as the environment changes.Three items in this download:1) Peppered moth analysis (Word)2) Peppered moth analysis (pdf)3) Answer key for the peppered moth analysis (Word)Here are a few other Evolution-based lessons:Natural S
Subjects:
Grades:
6th - 12th
Types:
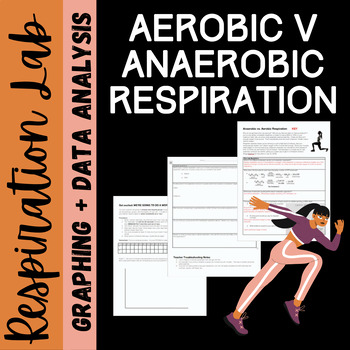
Anaerobic vs. Aerobic Respiration Lab
This lab asks students to pick a muscle group and push it to the point of anaerobic respiration. Students should have background knowledge before beginning this. This activity can be done using only a stop watch to time reps (sit-ups, push ups, etc.), but I like to borrow hand weights, yoga balls or pilates bands from the gym for extra fun. Kids really get into this activity!I have uploaded this in a .docx format, so you can edit and differentiate for your classroom and students' needs. Enjo
Grades:
7th - 12th
Types:
NGSS:
HS-LS1-7
Also included in: Photosynthesis and Respiration Bundle
Scientific Method NGSS Crosscutting Concepts Activity & PowerPoint
Students will have a great time learning about science skills, experimental design, NGSS Cross Cutting Concepts, and NGSS Science and Engineering Processes with this resource! And it's Google Ready! It's packed with teacher notes to make your job easy!All you need are two tennis balls per group, one meter stick per group and something to keep the tennis balls cold like a cooler or freezer. The data really shows the difference between the bounce of a cold tennis ball and a room temperature ball.
Subjects:
Grades:
5th - 12th
Types:
Terminal Speed Physics Lab & Graphing Activity using Coffee Filters {EDITABLE}
Do you want a teach your students about terminal speed, but can't find the time to put together a complex lab and then mark it all?
This is the lab for you!
This is part of my cost-saving, amazing Physics Bundle!
This is a quick lab that your students can complete start to finish in one class period. The student handout pages include:
• Purpose
• Question
• Rationale
• Materials
• Procedure
• Observation Table
• Graphing and Follow-up Questions + Conclusion
You'll need:
• meter stick
• coff
Grades:
7th - 12th
Types:
GRAPHING ACTIVITY Earth's Moon
This is a great way to incorporate graphing into a unit about Earth's Moon. Students will construct a total of 6 graphs (2 line graphs and 4 bar graphs) using data provided. Each part has questions to help students analyze the graph(s), apply information, and draw conclusions.
Part 1: Phases of the Moon
- Students will construct a line graph the percent of the illuminated part of the Moon seen from Earth each day for 1 month.
Part 2: Ocean Tides
- Students will construct a line graph for the
Subjects:
Grades:
8th - 12th
Types:
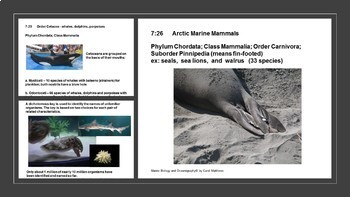
Polar Seas - Ocean/Marine Biology Unit 7
Polar Seas are unique habitats that influence climate and account for the diverse characteristics of polar animals such as Pinnipeds, Cetaceans and Penguins. They will use technology research skills, practice graphing from a computer program such as Excel, and to use photoperiods as a predictor to hemisphere location. Taxonomy is review by having students develop their own dichotomous key.Unit curriculum includes these bookmarked sections:IntroductionStudent SyllabusTeacher Pacing guideLesson Pl
Subjects:
Grades:
10th - 12th
Also included in: Marine Biology and Oceanography Full Year, 12 Unit Bundle
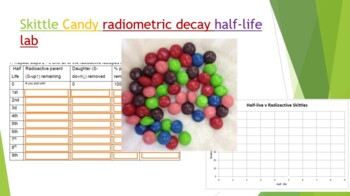
Skittle Radiometric Decay Half-life Lab
Did you know you can use Skittles candy to demonstrate absolute dating and radiometric decay! Buy a 1-4 lb bag at your local bulk warehouse store for savings. This lab is a great way to show how isotopes decay by shaking a plate full of random skittles. Students use Skittles to observe "Isotopes" decay over each half life. At the end of the lab (and only IF they have done all their work) they can enjoy their "daughter products". Skittles were used because they are durable, hypoallergenic, and th
Subjects:
Grades:
8th - 12th, Higher Education, Adult Education
Types:
NGSS:
HS-PS1-8
, HS-PS1-1
, HS-PS1-4
, HS-PS1-6
, MS-PS1-4
...
Also included in: Hands-on Science Semester Labs Bundle
Next Generation Science Lab: How Gross is your Phone? A Bacteria Lab
NGSS Claim and Reasoning lab where students design and culture bacteria found on their phone. This is an open ended inquiry lab. Students are given a list of materials and asked to come up with their own procedures to support a claim.
This lab goes with a unit over Bacteria and Viruses. I use this lab as a replacement for the recipe lab of growing bacteria. Since students are designing a test, and using their own property, it makes the learning all that more relevant!
I use this lab i
Subjects:
Grades:
7th - 12th
Types:
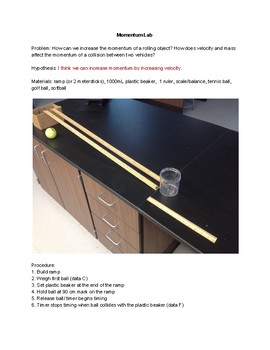
Momentum Lab
In this lab, students measure mass, calculate speed, and compare the force of momentum between balls of various masses. It is designed as an introduction to momentum and provides a common experience for the teacher to expand upon. It also serves as a review for calculating speed.Materials needed: ramp (or 2 metersticks), 1000mL plastic beaker (or any object that easily slides without falling over) 1 ruler (or another meterstick)scale/balancetennis ball, golf ball, and softball (or any 3 balls of
Subjects:
Grades:
7th - 12th
Types:
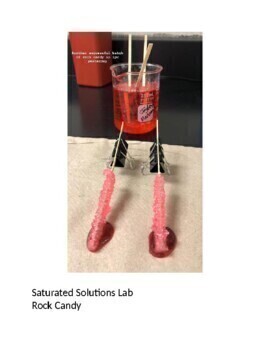
Chemistry High School Solubility Curve-Rock Candy Lab STEM
Your High School students will be motivated to perform about this experiment to determine the solubility curve for sugar at various temperatures. Written for the High School classroom it will make learning chemistry FUN. Detailed instructions and questions at the end to make certain that students have mastered the skill. Classroom-testedMaterialsMaterials150 mL water Teacher notes I found about 1:2.5 water: sugar ratio works well for crystals within a day. And it’s very important that they ad
Subjects:
Grades:
8th - 12th, Higher Education
Types:
NGSS:
HS-PS1-6
, HS-PS1-5
Also included in: High School Chemistry MEGA Bundle
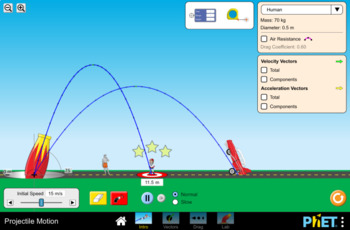
Projectile Motion Simulation Lab- PhET
This handout is meant to accompany the Projectile Motion simulation found here: https://phet.colorado.edu/en/simulation/projectile-motion
45 minute lesson time
This lab can be used to teach a range of concepts such as:
-Relationships between independent/manipulated and dependent/responding variables
-Forces in motion
-Projectile Motion
-The relationship between firing angle and distance traveled
-Graphing independent/ dependent variables
-Creating data tables
Subjects:
Grades:
6th - 12th, Higher Education, Adult Education
Types:
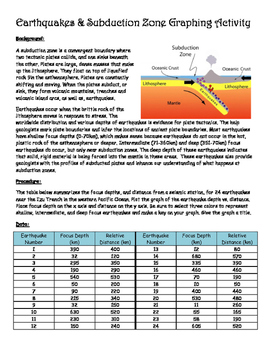
Earthquake Graphing Activity
In this assignment, students graph earthquakes at a subduction zone. Other than increasing their graphing skills, students will discover the various types of earthquakes based off of their depth. After graphing, students answer five analysis questions
Subjects:
Grades:
8th - 12th
Types:
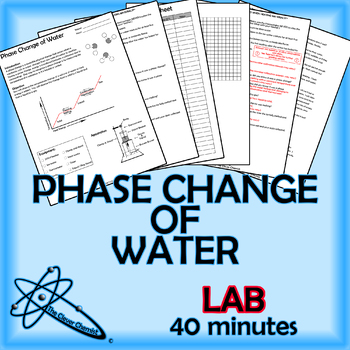
Phase Change of Water Lab
The Phase Change of Water Lab is a great way for students to observe phase changes, collect data, graph their results, as well as elaborate further on the concepts pertaining to this lab exercise. The lab has little preparation, easily done within a lab period, and has quick turn around for the next class period (if required).
Lab Includes:
Teacher's Notes (based on personal experience)
Materials List
Apparatus Setup
Student Lab
Answer Key
Graphing Paper (if you opt not to do Excel or Google
Subjects:
Grades:
8th - 12th
Types:
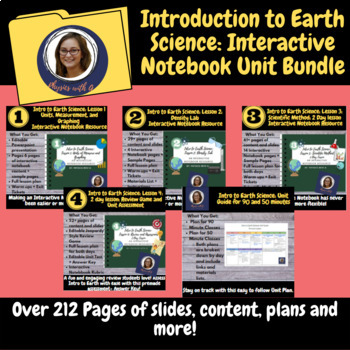
Intro to Earth Science: Interactive Notebook Unit Bundle
How to use these resources:In my course, I built an interactive notebook in a binder to help deal with that one thing about traditional Interactive Notebooks we all hate...skipping pages for makeup work. The traditional notebook did not have the flexibility I wanted and the students found them really difficult to manage at times. Sometimes staring at a blank notebook page is just too intimidating. By creating a notebook system that I could simply print and hole punch for students I gained the fl
Subjects:
Grades:
6th - 12th
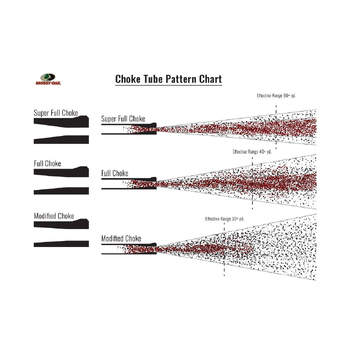
Ballistics Shotgun Spread Lab
Depending on the type of choke a shotgun has or the size of the shot (pellets fired) itself, the shot will disperse in a very predictable pattern. It will disperse in a circular pattern, and that pattern's diameter will change depending on how far away the target was.In this lab, the students will learn about the different types of chokes and how they disperse their shot. They will then do the following:Measure shot diameter from different chokes and shot diameterScale up these measurements from
Subjects:
Grades:
9th - 12th
Types:
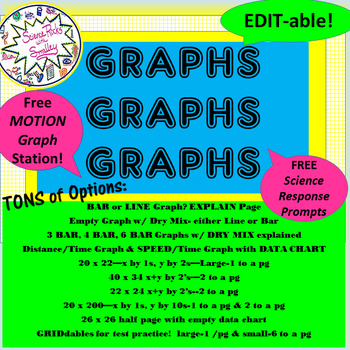
GRAPHS GRAPHS GRAPHS!!! Every format IMAGINABLE & Editable!!
I hope you enjoy having all these GRAPHS-- ready to go – available to you at anytime! They are each available in this file as pdf (not editable) and MS Office (editable). This is a collection of the many graphs I created for LABs and other things-- over the last 8 years. I included them both on a yellow background, and without, as it is much easier to see them on the background, but you won’t want it there for copying. There is a page for teaching Bar vs Line Graph, 3,4,5,6 Bar--BAR Graphs
Subjects:
Grades:
5th - 12th

Concept Comparison: Graphs in Science (Categorical vs Numerical)
How do scientists use graphs? This concept comparison helps students contrast bar graphs, pie charts and line graphs created from categorical and numerical data. The recall device uses DRY MIX and TRAILS as acronyms to help Ss remember how variables are plotted on a graph, and standard format for a graph. The frame comparison helps students contrast rate of change, slope shape and written relationships of functions (y vs. x; y vs. x^2; y vs. 1/x, and so on). THREE (3) activities are included:ha
Subjects:
Grades:
6th - 12th
NGSS:
HS-ETS1-3
, MS-ETS1-3
Also included in: StayGiant Physics Bundle: Measurement
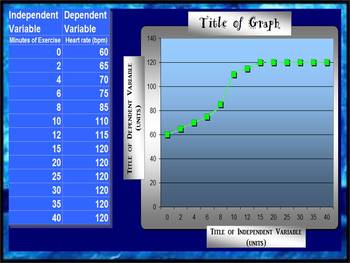
LINE GRAPH MAKER (AUTOMATIC)
This spreadsheet allows you to insert your independent and dependent variables into a chart and voila!... a line graph is generated as you enter in each piece of new data! Students love to take their data from a lab and watch as a graph is made right before their eyes! You can change all of the titles on the chart and the graph to suit your classes laboratory experiment needs! Students can easily print out their data to include in their lab reports!
Grades:
2nd - 12th
Types:
StayGiant Candy Mix Bundle: Lab Investigations
All of the materials including in this bundled Strategic Instruction download are available as individual products sold separately on TpT in the ScienceGiant store. Please click on each link to receive a detailed description. [BE ALERT TO STUDENT’S FOOD ALLERGY WARNINGS! Products may contain nut and other allergens].Teachers use the Strategic Instruction Model (SIM) Framing Routine to transform abstract main ideas and key topics into a concrete representation that helps students think about and
Subjects:
Grades:
6th - 12th
Types:
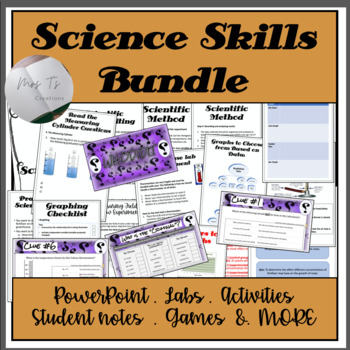
Science Skills Bundle
Science Skills Bundle: Graphing, Scientific Method, Use of Common Lab Equipment and MORE!Science skills are essential for success in Science, yet is rarely taught explicitly. This bundle of skills helps teachers to build a solid foundation in their students science skills. This bundle contains all the science skills that I have created and will continue to create for my science classes. They can be used in any type of science class and some can be used in maths classes also. They are appropriate
Grades:
7th - 12th, Staff
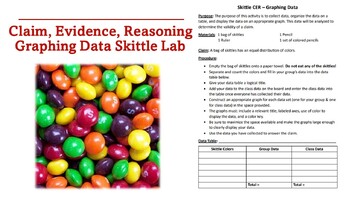
Claim, Evidence, Reasoning - Graphing Data Skittles Lab
This CER lab is a fun way to get students to collect, organize, and display data and then use that data as evidence to evaluate the validity of a claim. The file is editable so you may modify the assignment as needed to fit the needs of your students.
Subjects:
Grades:
7th - 12th
Types:
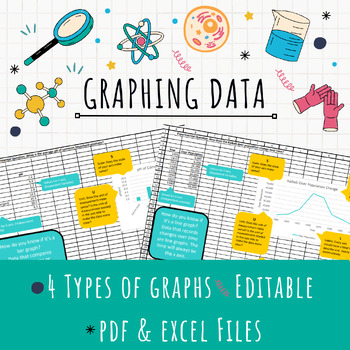
EDITABLE Excel Graphing Template
Teach graphing in Excel with this EDITABLE template! After collecting data, have your students represent it in a formal graph using Excel. This template provides helpful tips for students to determine the right kind of graph (bar, line, or pie) for their data and ALSO teaches them all the important parts of a graph.Assign the template for students to download and edit for a quick graphing solution or provide the pdf handouts for students who just need a little guidance!4 different kinds of graph
Grades:
7th - 12th
Types:
Showing 1-24 of 126 results


