121 results
Adult education environment laboratories
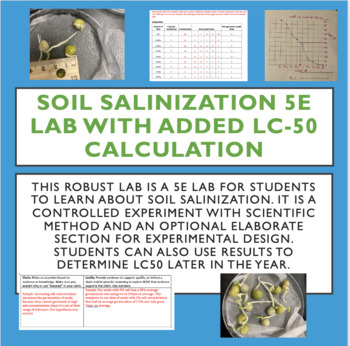
Salinization Lab 5E in-class experiment with added LC50
This lab has several parts. Some of which are optional. This lab fits with Unit 5 (irrigation) and Unit 8 (LD50) for AP Environmental Science and other science courses. Teacher notes and answer key are included.You can read how to set up the lab on my website: https://teachingapscience.com/soil-salinization-lab/ These are the parts of the lab:· Engage: Basic questions to access prior knowledge—takes 5-10 minutes· Explore Day 1: Students set up their labs –takes 25-35 minutes· Explore Day 2: Stud
Subjects:
Grades:
9th - 12th, Adult Education
Types:
Also included in: Unit 5 Bundle for AP Environmental Science
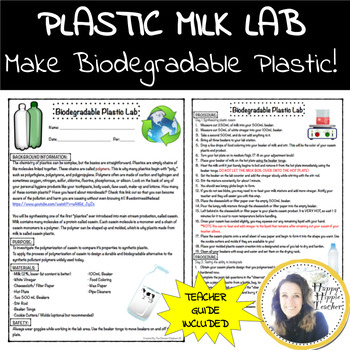
Plastic Milk Lab - Make Biodegradable Plastic!
THIS RESOURCE IS PART OF MY EARTH BUNDLE FOR A BIG DISCOUNT! Your students will have so much fun creating plastic casein from milk and vinegar with this lab! This is a great lesson to implement during your Earth Day unit, renewable energy unit, recycling unit, and many more! Teach your students to be forward thinkers and have them research topics including microplastics and garbage patches. A "re-purpose" junkyard lab would be an excellent follow up lesson to this lab. Get your students thinkin
Subjects:
Grades:
7th - 12th, Higher Education, Adult Education
Types:
Also included in: Environmental Science Bundle - Repurposing Project and Lab Activities
Populations Lab: Design a Study to Estimate the Size of a Population - NGSS
This activity proceeds as follows:1. Students brainstorm about why it is important to estimate the population of organisms2. Students learn how to estimate population using the “sampling” technique3. Students learn how to estimate population using the “mark and recapture” technique4. Students design a study to estimate a real population, and carry out their study.5. Extension Activity: Students read an article about the overfishing of Bluefin tuna, which is down to 4% of the population that it w
Subjects:
Grades:
5th - 12th, Adult Education
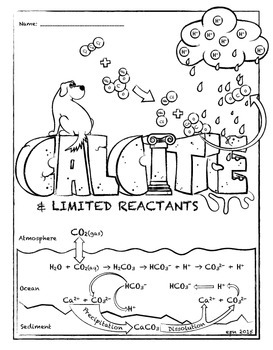
MAKING CHALK! Lab Activity (% Yield - Physical and Chemical Change)
Make CHALK!
Here’s a simple and fun lab to do with your students that’s educationally jam-packed. Aqueous solutions of sodium carbonate, (can also use baking soda), and calcium chloride, (aka Ice Melt), and you get calcium carbonate, (basically chalk) and table salt. Students collect the insoluble chalk by filtration and the salt remains in solution. Dry the precipitation to calculate the percent yield, and if you have time, evaporating the water from the saline solution and voila, you have yo
Subjects:
Grades:
6th - 12th, Higher Education, Adult Education
Types:

Plastic Eating Invertebrates Lab - Great for environmental science and biology!
This is a brand-new lab that I am SO excited to introduce to my environmental science students! Recent studies have come out demonstrating that different types of bugs are able to eat plastic. This lab allows students to recreate these studies and/or test out new variables of their choice! This lab is great because it can be tailored to the needs of your students - it can EASILY be made more or less difficult! You must have access to some type of invertebrate for this lab: it is recommended to u
Subjects:
Grades:
7th - 12th, Higher Education, Adult Education
Types:
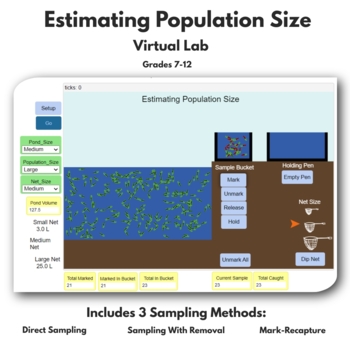
DISTANCE LEARNING Estimating Population Size Virtual Lab
In this biology virtual lab, students will practice using 3 sampling methods (direct sampling, sampling with removal and mark-recapture) to estimate population size of tadpoles in a pond using a simulation created by VirtualBiologyLab.org. The lab includes an introduction to population size and population density, as well as explanations and examples of each method. In the second part of the lab, students will use the various features of the simulation to collect tadpoles, mark them, hold them,
Subjects:
Grades:
9th - 12th, Higher Education, Adult Education
Types:
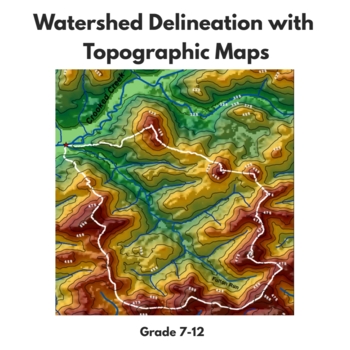
Watershed Delineation with Topographic Maps
In this activity, students will learn to delineate watersheds using topographic maps. The activity starts with students answering questions from the USDA article titled "How to Read a Topographic Map and Delineate a Watershed." They will then use their knowledge from these questions to delineate the Fulton Run watershed, located in Indiana, Pennsylvania. There are two topographic maps included in the product - one for more advanced learners and one for less advanced learners. The map for less ad
Subjects:
Grades:
7th - 12th, Higher Education, Adult Education
Types:
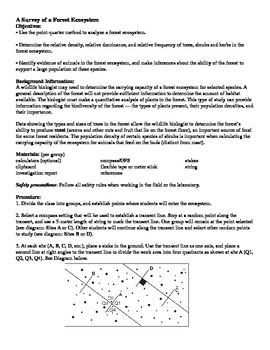
A Survey of a Forest Ecosystem - Science in the Environment Lab Series
A wildlife biologist may need to determine the carrying capacity of a forest ecosystem for selected species. A general description of the forest will not provide sufficient information to determine the amount of habitat available. The biologist must make a quantitative analysis of plants in the forest. This type of study can provide information regarding the biodiversity of the forest — the types of plants present, their population densities, and their importance.
Data showing the types and siz
Subjects:
Grades:
7th - 12th, Higher Education, Adult Education
Types:
Marine Science Inquiry Lab: Create 80 mL of 3.5% Saltwater - Makes 'em Think!
Product Description: If you are looking for something GREAT to do in the first week with your marine science kids - something that'll make them learn and think - this is a pretty good tool to have. Here's how this lesson would go: Students use an online credible source to look up the oceans average salinity Parts per thousand is explained (I actually made 1000 red dots, haha.. ugh) along with its funny looking symbol Students learn how to convert parts per thousand to a percentageStudents learn
Subjects:
Grades:
7th - 12th, Adult Education
Types:
Also included in: Marine Science Bundle - for A.K: (5) Cool Labs, (2) Webquests, (1) Notes
AICE Marine Science Lab: Do Mangroves Really Cause Sedimentation - Chap 5
Our AICE Marine Science students must understand the role mangrove prop roots play in the world of sedimentation and erosion: Can mangroves really cause sedimentation? This is a fairly inexpensive lab that can be set up to put that hypothesis to the test. Here's how this lab could go: Teacher groups students into lab groups using your chosen method Teacher passes out student lab handout (see preview to view this) Teacher presents to the class the whole group review of the lab. This can also be m
Subjects:
Grades:
9th - 12th, Adult Education
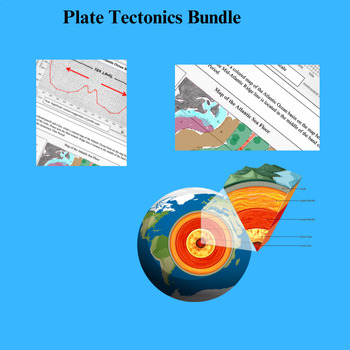
Worksheets: Plate Tectonics Bundle
This Bundle consists of 6 Plate Tectonic Worksheets/Lab Activities;* Locating Patterns of Earthquakes and Volcanoes* Mid Atlantic Ridge Profile and Sea Floor Spreading*Plate Boundary Worksheet*Properties of Earth's Interior*Distance from Trench vs. Earthquake Depth*Hawaiian Island Hot Spot These are very good resources to augment teaching of the NYS Dynamic Crust Unit, or instructing students regarding Plate Tectonics Theory.
Subjects:
Grades:
6th - 12th, Higher Education, Adult Education
Types:
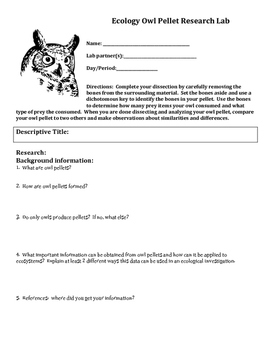
Ecology Owl Pellet Food Chain Food Web Research Inquiry Lab
This is one of my students' favorite labs! They enjoy working in partners to determine what kinds of animals owls eat - and then to apply that knowledge to draw conclusions. Students have found everything from an entire bird skull (intact) to a snake skeleton mixed in with all of the vole, shrew, rat and mice bones. I love the many different concepts I can tie into this lab and the many directions we can go to make connections. I hope you enjoy this lab as much as my students and I do!
This
Subjects:
Grades:
7th - 12th, Higher Education, Adult Education
Types:
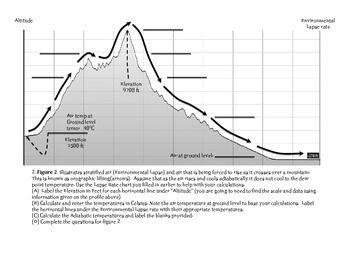
Death Valley: A Case Study of Earth Systems Interactions on Climate
This is a very thorough student driven investigation intended to show the inter-relationships between weather concepts as well as the interactions of earth's major systems. How does the Pacific ocean, the Sierra Nevada Mountains, and prevailing winds make death valley one of the most inhospitable places on earth? Students will calculate, research, and take data to delve deep into applying concepts including humidity, phase change, latent heat, lifting, adiabatic lapse rates, and trends of temp
Subjects:
Grades:
9th - 12th, Higher Education, Adult Education
Types:
CCSS:
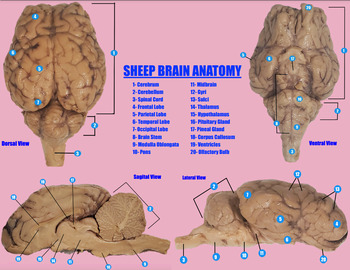
Sheep Brain Anatomy Poster Mat
This mat was made to help students locate the different components of the brain during their sheep brain dissections or when learning about the brain. This is also helpful in learning about the brain's different structures and what they look like. Any questions can be sent to me at my email: Monica.Spatafore21@gmail.com
Subjects:
Grades:
9th - 12th, Higher Education, Adult Education
Types:
NGSS:
HS-LS1-2
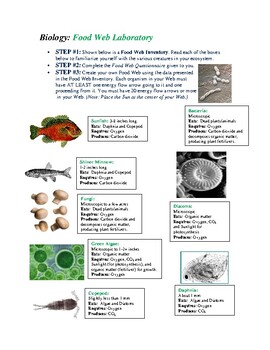
Marine Biology Food Web Laboratory
This dynamic two-part lab activity takes students into the fascinating world of marine life. Rich with rigorous questions and beautifully illustrated, this lab activity will captivate and inspire students in ways that are sometimes difficult in the regular classroom setting. Ideal for a cooperative learning strategy, Marine Biology Food Web comes with step-by-step instructions, and a complete answer key for teachers.
Subjects:
Grades:
6th - 12th, Higher Education, Adult Education
Types:
NGSS:
HS-LS2-3
, HS-LS2-4
, HS-LS2-1
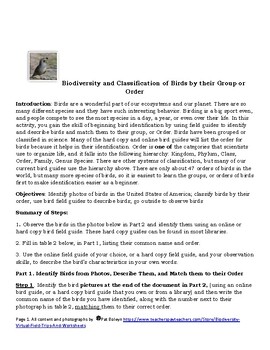
Bird Biodiversity: Knowing the Bird Groups (Orders)
Worksheet on how to know the birds by their group, or Order. This has color pictures of the birds that the student matches to the correct group or order. The student also describes and identifies the photos of the birds using hard copy or online bird guides. Classification of life, can be taught before the worksheet is handed out, with the worksheet serving as an example of how birds are classified. The assessment is direct grading of the worksheet table, where the student has matched the bird t
Subjects:
Grades:
11th - 12th, Higher Education, Adult Education, Staff
Types:
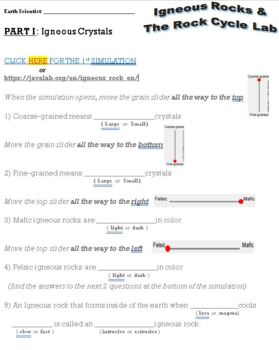
Igneous Rocks & The Rock Cycle Virtual Simulation Lab
** NO FLASH REQUIRED ** Igneous Rocks & The Rock Cycle Virtual Simulation Lab uses interactive, online sites to teach about the crystal size & color of Igneous Rocks and Various stages of the Rock Cycle. In Part I, students will determine if a rock has Fine or Coarse Grins (crystals) and classifying the darkness or lightness as Mafic or Felsic. In Part II, students will see the various stages of the rock cycle and how it moves from stage to stage. Part III is Extra Credit for thos
Subjects:
Grades:
6th - 12th, Adult Education
Types:
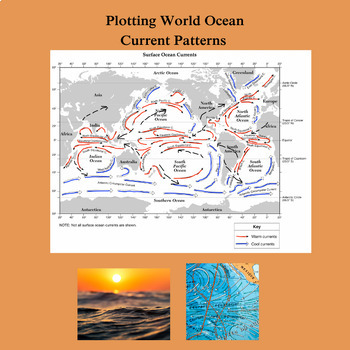
Plotting World Ocean Current Patterns
The students examine the location and direction of major ocean currents on the Earth. Through guided exploration, the students realize that ocean currents are not random but controlled by global winds and the Coriolis Effect.The exercise involves coloring a map of ocean currents either red (warm currents) or blue (cool currents). They also superimpose global wind patterns on the map, and fill in a chart of whether the currents are on the east or west side of ocean basins and if they go towards o
Subjects:
Grades:
6th - 12th, Higher Education, Adult Education
Types:
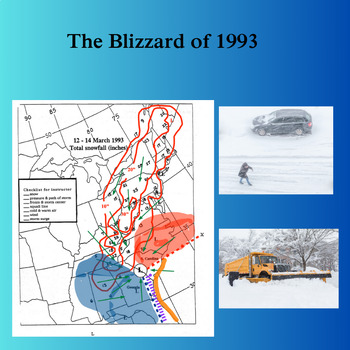
The Blizzard of 1993
With this pencil and paper laboratory exercise, students plot the location of the historic blizzard of 1993 over several days. They create isolines of snow thickness, plot the location of the Low Pressure Center, draw arrows displaying wind direction, and several other items. This is a very good exercise with lots of coloring, which students love. The New York State Earth Reference Tables, or a map showing the Gulf Stream off the southeast coast of the United States will be needed.The Reference
Subjects:
Grades:
6th - 12th, Higher Education, Adult Education
Types:
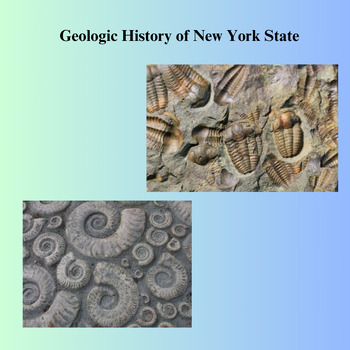
Geologic History of New York State
This paper lab exercise encourages the students to become thoroughly familiar with pages 8 and 9 of the NYS Earth Science Reference Tables, The Geologic History of New York State. As most NYS Earth Science instructors are aware, these are two pretty complicated pages to look up Eras,Periods, what creatures lived when, various orogenies, and more.The New York State Earth Science Reference Tables are needed to do this lab. If you don't have a copy they can be downloaded at: https://www.nysed.gov/s
Subjects:
Grades:
6th - 12th, Higher Education, Adult Education
Types:
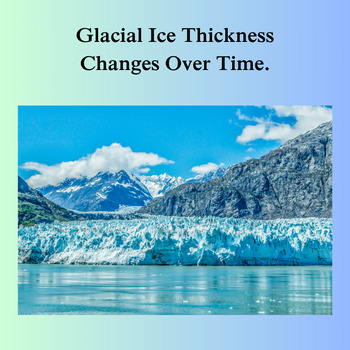
Glacial Ice Thickness Changes Over Time.
The Students examine the relationship of glacial ice thickness over time for two valley glaciers. A graph with two line plots, one for each glacier, is constructed to show what happened to glacial ice thickness over a 25 year period. The students also define several vocabulary terms and answer 8 discussion questions. As the graphs clearly show a decrease in thickness over time, the students can deduce it is related to global warming.Customer Tips: How to get TPT credit to use on future purchases
Subjects:
Grades:
6th - 12th, Higher Education, Adult Education
Types:
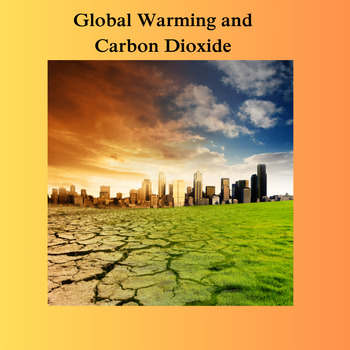
Global Warming and Carbon Dioxide
With this paper and pencil laboratory, the Students examine 4 different graphs pertaining to Carbon Dioxide buildup in the Atmosphere over time. There are 14 interpretive questions pertaining to the graphs, which help students understand the relationship between Carbon Dioxide build up, Atmospheric Warming, and the relationship of both to our society.Customer Tips: How to get TPT credit to use on future purchases:Go to your "My Purchases" page. Beside each purchase, you will see a "Provide Feedb
Subjects:
Grades:
6th - 12th, Higher Education, Adult Education
Types:
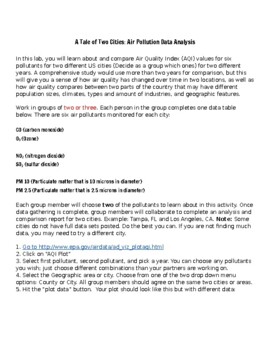
Air Quality Index Comparison Lab
In this lab, you will learn about and compare Air Quality Index (AQI) values for six pollutants for two different US cities (Decide as a group which ones) for two different years. A comprehensive study would use more than two years for comparison, but this will give you a sense of how air quality has changed over time in two locations, as well as how air quality compares between two parts of the country that may have different population sizes, climates, types and amount of industries, and geog
Subjects:
Grades:
9th - 12th, Higher Education, Adult Education
Types:
Marine Science Lab: Using pH To Track Productivity Rates of Elodea
Product Description: If your kids are learning about photosynthesis, and respiration, or how those two process and a lack of sunlight create the oxygen minimum layer, this 96 slide interactive virtual lab is a great resource to have. I made this lab specifically for my AICE AS level marine course students, but it is fully applicable for regular or honors level marine courses. (AICE teachers - The oxygen minimum layer, OML, is fully applicable to the new course syllabus, and is in the new course
Subjects:
Grades:
9th - 12th, Adult Education
NGSS:
HS-LS2-5
Showing 1-24 of 121 results

