27 results
Higher education graphing laboratories
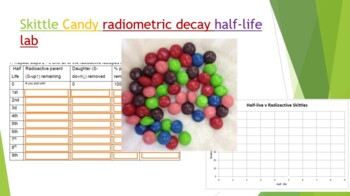
Skittle Radiometric Decay Half-life Lab
Did you know you can use Skittles candy to demonstrate absolute dating and radiometric decay! Buy a 1-4 lb bag at your local bulk warehouse store for savings. This lab is a great way to show how isotopes decay by shaking a plate full of random skittles. Students use Skittles to observe "Isotopes" decay over each half life. At the end of the lab (and only IF they have done all their work) they can enjoy their "daughter products". Skittles were used because they are durable, hypoallergenic, and th
Subjects:
Grades:
8th - 12th, Higher Education, Adult Education
Types:
NGSS:
HS-PS1-8
, HS-PS1-1
, HS-PS1-4
, HS-PS1-6
, MS-PS1-4
...
Also included in: Hands-on Science Semester Labs Bundle
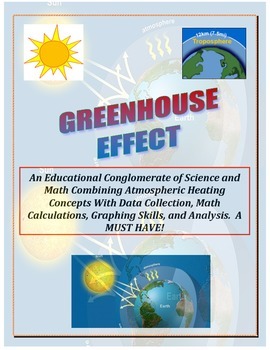
Weather LAB: Greenhouse Effect (A Must have for Combining Science and Math!)
PROCEEDS BENEFIT "REACH INC."-EMPOWERING ADULTS WITH DISABILITIES
http://www.reachinc.org
-Southern Science Specialists - Chapel Hill, North Carolina-
A MUST HAVE!
The Greenhouse Effect – one of the MOST MISUNDERSTOOD concepts in Earth Science. This LAB is a MUST HAVE! See PREVIEW!
A great blend of math (calculations and graphing), meteorology, physical science, and the scientific method.
No Materials? NO Problem! Students can complete this lab with the recommended materials or without u
Subjects:
Grades:
5th - 10th, Higher Education
Types:
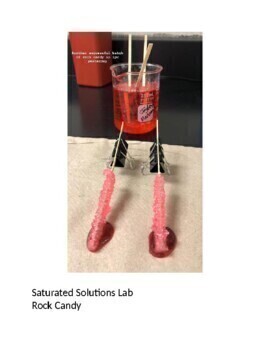
Chemistry High School Solubility Curve-Rock Candy Lab STEM
Your High School students will be motivated to perform about this experiment to determine the solubility curve for sugar at various temperatures. Written for the High School classroom it will make learning chemistry FUN. Detailed instructions and questions at the end to make certain that students have mastered the skill. Classroom-testedMaterialsMaterials150 mL water Teacher notes I found about 1:2.5 water: sugar ratio works well for crystals within a day. And it’s very important that they ad
Subjects:
Grades:
8th - 12th, Higher Education
Types:
NGSS:
HS-PS1-6
, HS-PS1-5
Also included in: High School Chemistry MEGA Bundle
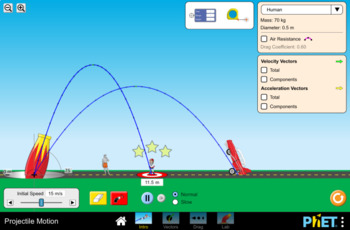
Projectile Motion Simulation Lab- PhET
This handout is meant to accompany the Projectile Motion simulation found here: https://phet.colorado.edu/en/simulation/projectile-motion
45 minute lesson time
This lab can be used to teach a range of concepts such as:
-Relationships between independent/manipulated and dependent/responding variables
-Forces in motion
-Projectile Motion
-The relationship between firing angle and distance traveled
-Graphing independent/ dependent variables
-Creating data tables
Subjects:
Grades:
6th - 12th, Higher Education, Adult Education
Types:
Quadratic Function Activity About Your Dental Arch
Through this activity students will discover properties of parabolas while comparing the parabola they all carry around with them every day - their dental arch. Students will brainstorm ways to measure a dental arch and ultimately take an "impression" of their arch by taking a bite out of a slice of bread. Then they will trace their arch onto a graph, use the graph to generate a table of values, and then use the table to plug into an equation for the most "perfect" dental arch. Students love
Subjects:
Grades:
8th - 12th, Higher Education, Adult Education
Types:
Also included in: Quadratic Functions Activities Bundle
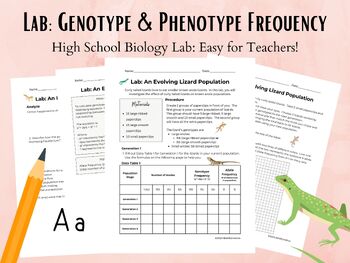
Lab: Genotype and Phenotype Frequency in Lizard Populations
This is a High School Biology lab where students will model changes in a populations traits. They will calculate genotype and phenotype frequency and monitor its changes over the course of 4 generations of lizards. Students will use A data table2 line graphthe Hardy Weinberg formula for genotype frequency Answer analysis questions. Teacher setup is minimal. Supplies are inexpensive and easily found in schools or at an office supply store. NGSS Standard CoveredLS3: Heredity: Inheritance and Var
Grades:
9th - 12th, Higher Education
Types:
CCSS:
NGSS:
HS-LS3-3
Micro:bit Accelerometer Funcamentals
This lesson demonstrates how to use and gather information from the Micro:bit accelerometer. Use this lesson to reference lessons in science and math.The accelerometer measures motion and acceleration. Use this information to reference concepts learned in science on mass, motion, acceleration, and velocity. Use the sensor to measure motion, acceleration, and velocity.The accelerometer measures acceleration along the x, y, and z planes. Use this information to reference the coordinate plane used
Subjects:
Grades:
3rd - 12th, Higher Education, Adult Education, Staff
Types:
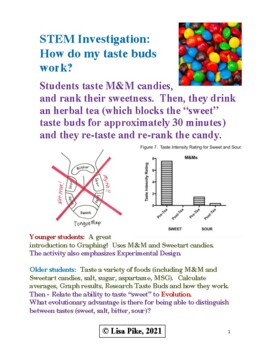
The NEW Taste Test - Blocks Taste Receptors, Students Learn Graphing/Analysis
Focus Question:How do we perceive flavor?How do our taste buds work?Conceptual Understanding: Plants and animals have physical characteristics that allow them to receive information from the environment. Structural adaptations within groups of plants and animals allow them to better survive and reproduce. This is NOT your old fashioned Tongue map (debunked) - but an actual experiment where taste receptors are blocked temporarily. Students learn about taste, and older students learn about tast
Subjects:
Grades:
3rd - 12th, Higher Education, Adult Education
Types:
NGSS:
4-LS1-1
, MS-LS1-3
, MS-LS1-1
, HS-LS4-2
, MS-LS1-4
...
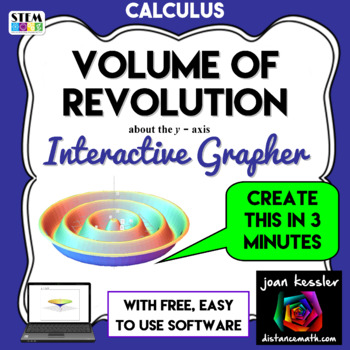
Calculus Interactive Volume of Revolution y-axis Grapher
This Calculus Interactive Volume of Revolution Surface of Revolution about the y-axis Grapher will wow your kids with LIVE interactive math explorations and animations. My students think this is awesome. This Easy 3D grapher will demonstrate and explore the volume of revolution in your classroom as never before. Incorporate this applet into your traditional lessons, Power Points, or Smart Board lessons or use as a free standing "app" to explore with your class. "What do you think would hap
Subjects:
Grades:
11th - 12th, Higher Education
Types:
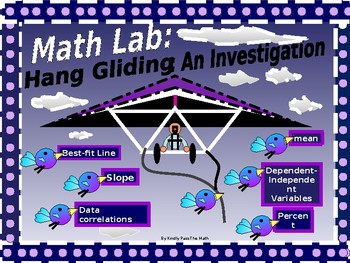
Math Lab An Algebra Review Via Hands-on Glider Investigation
Please join me in my enthusiasm for Math Lab Investigating Gliders!The lab is a two day event that covers and reviews multiple concepts covered in Algebra I, semesters I and II* It is outstanding for bringing concepts back to students prior to finals and for assisting them in applying mathematics to real life situations.* This 50 page investigation requires the student to address the relationship between the wing-span of a glider and the distance that it can fly.* On day one, students work in
Subjects:
Grades:
7th - 12th, Higher Education, Adult Education
Types:
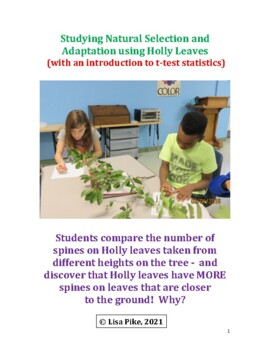
Holly Leaf Spines: an example of natural selection and adaptation
In this lab we will answer the question: Is the number of spines the same on leaves found at all heights on the Holly tree? Holly is just one example of the fluctuations in shape and form of an organism; the variation that any species can exhibit. It is important to recognize that this variation, or plasticity, is normal, and often relates to different environmental conditions (including competition and predation). The ability of an organism to change its characteristics in response to environ
Subjects:
Grades:
6th - 12th, Higher Education
Types:
NGSS:
HS-LS4-3
, HS-LS4-4
, MS-LS4-4
, MS-LS4-6
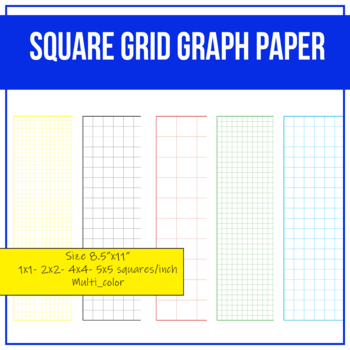
Square Grid Graph Paper / Multi-color Size 8.5 x 11 in
These blank grid graph paper will be great for elementary math, geometry, calculus, trigonometry, physics, engineering, drawings, drafting, planning, arts, making graphs, puzzles, homework assignment or even for quick notesThey are 8.5 x 11 in (letter size). Files are provided in .png with transparent background, jpg white background and pdf. All with black & white, blue, red, green, and yellow color.All images or pictures are high resolution so you can have large illustrations of them and t
Subjects:
Grades:
PreK - 12th, Higher Education, Adult Education, Staff
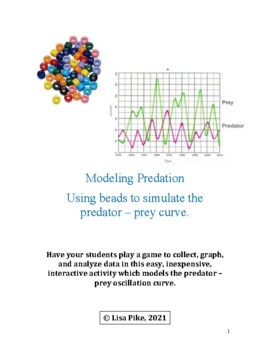
Modelling the Predator-Prey oscillation curve
Focus Question(s): How are predator and prey population sizes related? How do predators function to keep prey populations low and stable? How do prey population sizes limit predator populations? Using about 150 blue beads (=prey) and about 75 yellow beads (=predator), small ‘dixie’ paper cups, and dice, students play a game that allows them to collect and graphically display data on the effects of predators on prey populations - resulting in teh classic predator / prey oscillation curve. It i
Grades:
5th - 12th, Higher Education
Types:
NGSS:
MS-LS2-2
, MS-LS2-3
, MS-LS2-1
, HS-LS2-4
, HS-LS2-1
...
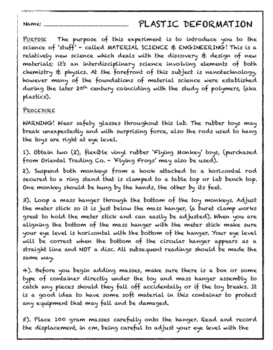
FLYING MONKEYS AND PLASTIC DEFORMATION
The purpose of this experiment is to introduce your students to the science of ‘stuff’ - called MATERIAL SCIENCE & ENGINEERING! This is a relatively new science which deals with the discovery & design of new materials; it’s an interdisciplinary science involving elements of both chemistry & physics. At the forefront of this subject is nanotechnology, however many of the foundations of material science were established during the later 20th century coinciding with the study of polymer
Subjects:
Grades:
7th - 12th, Higher Education, Adult Education
Types:
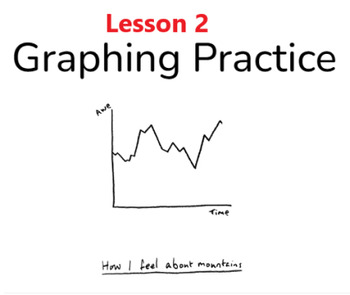
Science/Math - using Nearpod - GRAPHING PRACTICE LESSON 2
Are you looking for a tool that can freely supply a student with all the information needed to teach them with very little or no work from you? Well then this is the resource for you. This tool will prompt students with critical thinking exercises and challenges that address key ideas but supply the explanations as well. This teaching device can be provided to students in a full class forum or can be assigned as independent study. The following lesson is one of many to engage students in the ent
Grades:
5th - 12th, Higher Education
Types:
CCSS:
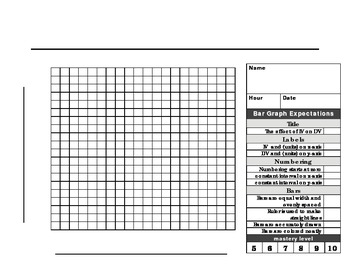
Bar Graph paper and rubric
This 20 X 20 graph paper with rubric is made for a beginner scientist to make a the perfect BAR graph. The checklist format makes it easy for students to know what is expected when graphing. Enjoy!
Subjects:
Grades:
1st - 12th, Higher Education, Adult Education
Types:
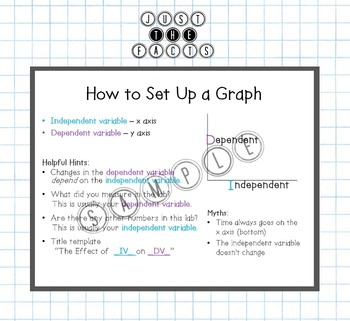
Graphing Basics- Poster & Interactive Notebook Handout
This download comes with 4 different print formats of a simple yet great quality set of directions for graphing. I have this hanging up in my high school science classroom and love it. I also handout the quarter sheet copies for students to keep in their interactive notebooks.
Download includes:
8.5x11 pdf poster
11x17 pdf poster
Two 11x17 pdf pages to make a jumbo poster
8.5x11 pdf containing 4 copies for student interactive notebooks
Grades:
6th - 12th, Higher Education
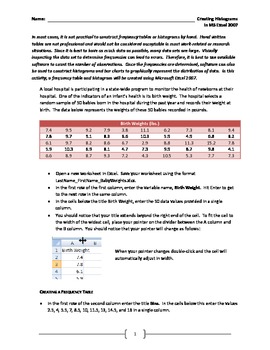
Creating Frequency Tables and Histograms in MS Excel 2007
This activity looks at a realistic data set and walks the student through constructing a frequency table and histogram using Microsoft Excel. It should be noted that Excel is not the best software package for creating histograms, but because it one of, it not the most widely used software package for data storage and presentation in business, it is important to know how to create professional-looking and statistically accurate graphics using this tool.
There are two different ways to constru
Subjects:
Grades:
11th - 12th, Higher Education
Types:
Germinating Seeds
In this lab we will look at four things: the effects of planting depth, seed orientation, and seed size, on germination of seedlings and also the application of growth hormone gibberellic acid on growth rates of young seedlings.Germination begins with water imbibition (uptake) by the seed and ends when the seedling emerges from the soil.So, once you are able to detect seedling growth, germination has finished and the seedling developmental stage has begun.We will measure how long it takes to com
Grades:
4th - 10th, Higher Education
Types:
NGSS:
4-LS1-1
, MS-LS1-3
, MS-LS1-4
, 4-LS1-2
, HS-LS1-3
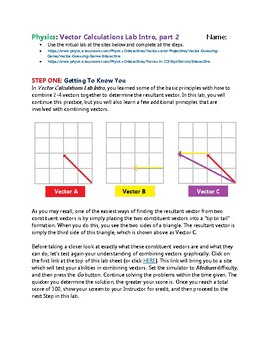
Physics: Vector Calculations Lab-Introduction, part 2
Would you like some assistance in teaching vectors to your Physics or Math classes? This lab might be just what you are looking for. Elegantly illustrated and clearly written in a step-by-step manner, this lab walks the students through the key introductory principles involving vector calculations. Picking up where Physics: Vector Calculations Lab-Introduction left off, this lab explores a few more of the finer details of combining vectors. Combining vectors can be a challenging task, but this s
Grades:
7th - 12th, Higher Education, Adult Education
NGSS:
MS-ETS1-4
, MS-ETS1-3
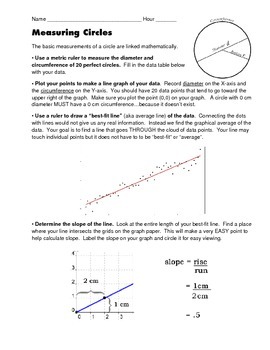
Measuring Circumference and Diameter to Calculate Pi
This classic activity shows the relationship between the circumference and diameter of a circle. When you plot the points on the included graph paper, the slope of the line equals pi (3.14....)
Subjects:
Grades:
6th - 12th, Higher Education
Types:
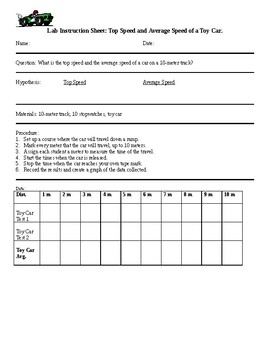
Lab; The Top Speed and the Average Speed of an RC Car
This lab uses simple math, a meter stick with tape track, and differentiation to get all the kids involved in the lab.This could be completed inside in a hallway or a basement.
Subjects:
Grades:
6th - 12th, Higher Education, Adult Education, Staff
Types:
Also included in: Physics Labs
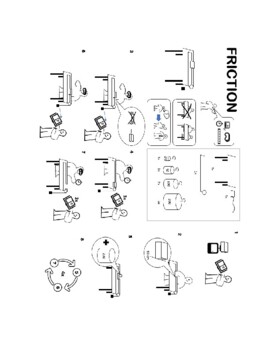
Friction Dynamics Lab - Calculating Coefficient of Friction
In this lab, students calculate the normal force and friction force using a wooden block on a wooden ramp. The resulting data is then graphed to determine the coefficient of friction for the two surfaces in contact.
Grades:
11th - 12th, Higher Education, Adult Education
Types:
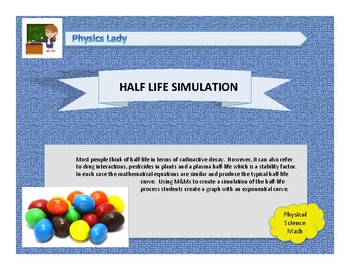
HALF-LIFE SIMULTION
Most people think of half-life in terms of radioaictve decay. However, it can also refer to drug interactions, pesticides in plants and a plasma half-‐life which is a stability factor. In each case the mathematical equations are similar and produce the typical half-life curve. Using M&Ms to create a simulation of the half-‐life process students create a graph with an exponential curve.
Subjects:
Grades:
7th - 12th, Higher Education
Types:
Showing 1-24 of 27 results


