22 results
7th grade graphing rubric pdfs
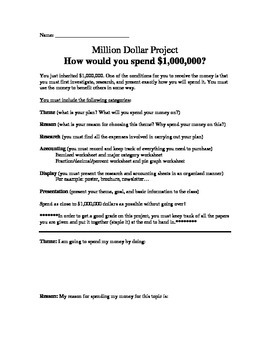
Million Dollar Project (Graphing, decimals, fractions, accounting and percents)
What would you do with a million dollars? How would you spend it?
In this project you've been left a 1 million dollar inheritance. The catch is you must first research and present how you will spend the money.
In the first part of the experiment, the students will fill out an accounting chart, where they will fill out an itemized chart displaying each item they plan on purchasing to complete their million dollar project. They will than be asked to put all those items into major categorie
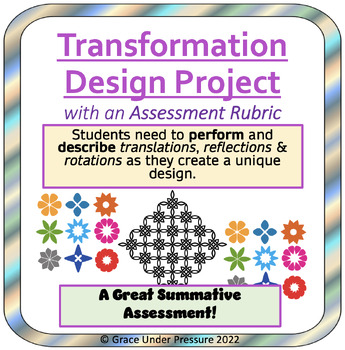
Transformation Geometry Project with an Assessment Rubric: Gr 6-8 Geometry
This creative and fun math geometry project assesses students’ ability to perform and describe 3 kinds of transformations: translations, rotations, and reflections. It is a great summative assessment for your transformation unit!It will take several work periods for students to create their design and write or type a detailed explanation of the process. This is how I can really see if they understand the concepts. I encourage students to describe their process using specific mathematical vocabul
Subjects:
Grades:
6th - 8th
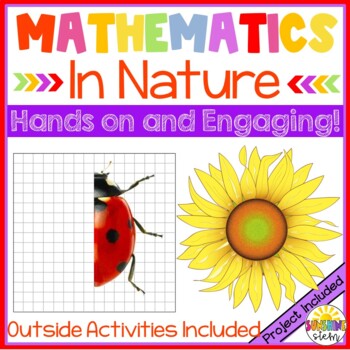
Mathematics in Nature {CCSS Math and NGSS Aligned}
Students explore and apply the principles of mathematical patterns in nature in a fun and engaging way! First, students identify and describe patterns in the natural world before heading outside to find patterns on their own. Next, students begin to explore number patterns in nature using the Fibonacci sequence. Fin fingerprint activity keeps students interested and engaged! Next, explore cycles in nature by creating a model on paper using 3-dimensional objects. Rubric included. Students are
Grades:
4th - 7th
Types:
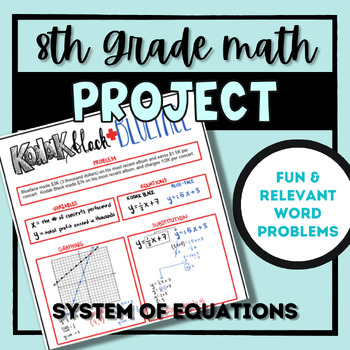
System Of Equations Project (With Relevant Student Problems)
This project incorporates relevant-to-student word situations and has students create, solve, and describe the equations, graphs, and tables of the two equations, as well as the solution to the system. It includes student handouts, an answer key, and rubrics for students, as well as a student-exemplar for them to refer to. It also includes an editable link to quickly change the names and make it more relevant to your students!
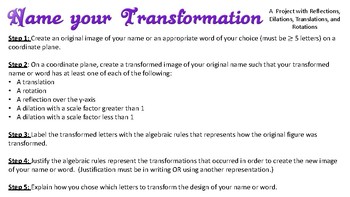
Transformations Project - Translations, Rotations, Reflections, and Dilations
This short project called "Name your Transformation" is designed to give students the opportunity to create a graphical image of their name or word of their choice and then transform it in a way that creates a fun design of their name or word. Steps and criteria are provided for students to transform the figures or letters of their name/word and justify their work. Graph paper is provided for their original image but students are encourage to complete their transformed image on a larger grid pap
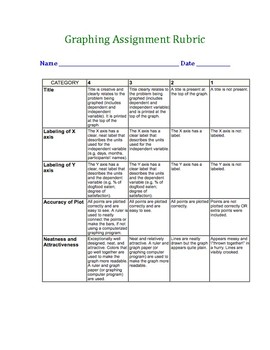
Graphing Rubric for Student Graphs
see preview.....check preview!100 WORD SEARCHES HERE!!!!!THIS RESPONSE JOURNAL MIGHT BE HELPFUL, TOO!POSTERS FOR YOUR CLASSROOM!GREAT RUBRIC BUNDLE!MY BEST PRODUCT-BUSINESS CLASS!GOOD CHARACTER WORD SEARCH!GROUP WORK SELF-EVALUATION!SOCIAL STUDIES BUNDLE…Lots of presentation rubrics!
Subjects:
Grades:
7th - 12th
Types:
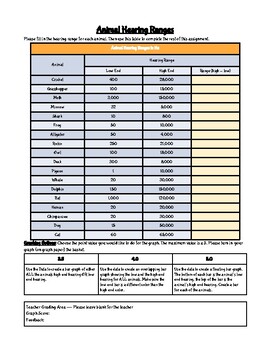
Graphing Animal Hearing Ranges (Scaffolded graphing)
This worksheet has students look at a variety of animal hearing ranges and then graph (leveled options) the hearing ranges and answer questions using the data.
Grades:
6th - 10th
CCSS:
NGSS:
MS-LS1-3
, MS-LS1-4
, MS-LS1-8
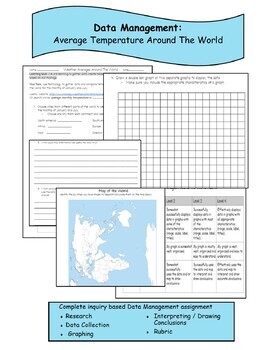
Data Management Assessment-Average Temp Around The World -Distance Learning
This comprehensive Data Management assessment incorporates real life application and authentic learning. This activity can be used as a formative assessment during a unit, after a unit or part of your math centers. It incorporates inquiry and research to engage and stimulate learning.It includes:ResearchData CollectionGraphingInterpreting, Analyzing and Drawing ConclusionsRubric
Math Project Create a Linear Function *DISTANCE LEARNING
PRINT and DIGITAL * * Makes distance planning so much easier!Math Project Create a Linear FunctionAre you looking for a way to assess your students' understanding of linear functions? Create a Linear Function Project is just what you are looking for. Your students will create a real-world linear function for the project showing you that they know how to model linear functions, write in function notation, find solutions to a linear function, interpret elements of linear functions, and prove cert
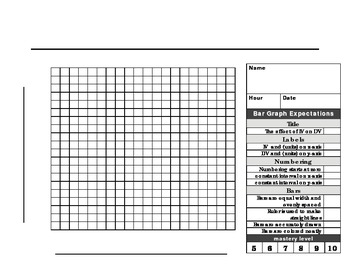
Bar Graph paper and rubric
This 20 X 20 graph paper with rubric is made for a beginner scientist to make a the perfect BAR graph. The checklist format makes it easy for students to know what is expected when graphing. Enjoy!
Subjects:
Grades:
1st - 12th, Higher Education, Adult Education
Types:
Valentines Day Coordinate Plane Project-All four quadrants
This is an open ended kind of project to allow students to be creative on the coordinate plane. An example is attached that you can show your students. A rubric is attached to the document so that you can grade this if you choose, and your students know what to expect about how this will be graded. I use this project every year for my 6th grade students, and they love the choice of creativity that this project offers. Students can complete this on blank graph paper. I always require the followin
Subjects:
Grades:
5th - 8th
Types:
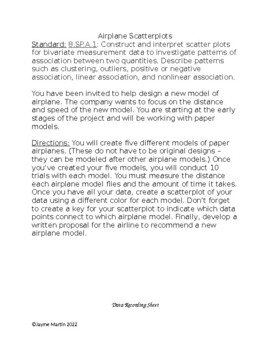
Airplane Scatterplots
This project gets students actively engaged by having them create model airplanes, fly them, measure the distance and use scatterplots to display the data and find trends. Great way to make the assignment come alive.
Million Dollar Math: What would YOU do with ONE MILLION $$?
Spending one million dollars sounds like so much fun. It is actually work when students realized just how MUCH money that truly is. Students will use creativity, problem solving, creating a pie chart, computing percentages, documenting internet research, and oral presentation skills in this enticing project. Each student selects his/her own topic so they will be passionate and fully immersed in their dream project. Suitable for grades 5+ and takes approximately 10 days to complete, with a couple
Subjects:
Grades:
5th - 7th
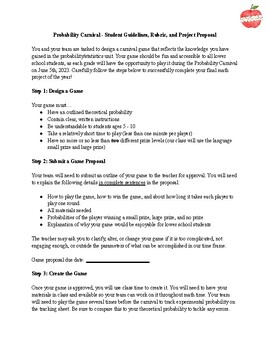
Probability Carnival Freebie
Students will dive into the core skills of probability by designing, creating, proposing, and reflecting upon a carnival game (a bloom's taxonomy dream)! Use and adapt this resource to fit the needs of your classroom to create a memorable learning experience. *Highlights: probability, statistics, graphing, project based learning, game design, teamwork, student-centered learningOptional inquiry-based learning essential question: How can we, as mathematicians, design and create an age appropriate
Subjects:
Grades:
3rd - 8th
Sweetheart Date-A Analysis Project
In this summative assessment students work collaboratively using a box of sweethearts to develop statistical questions, collect data, calculate measures of central tendency and variability, and create appropriate graphs for the data set. This project includes a self-assessment and rubric. Check out my IB Checklist for Groupwork to help students be accountable.
Subjects:
Grades:
6th - 8th
Types:
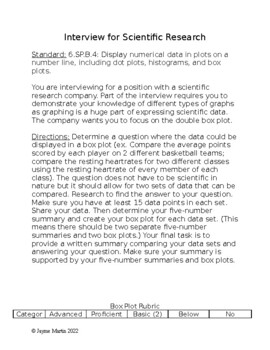
Interview for Scientific Research
Students take their knowledge of box plots and use real-world data to display their ability to create and analyze the box plot. Great way to allow students to research an area of interest while showing a connection to math. Great project or assessment.
Subjects:
Grades:
6th - 7th
Types:
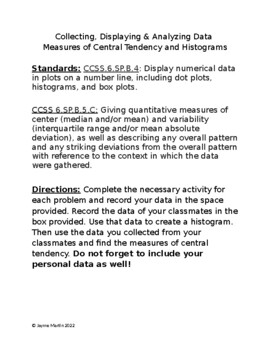
Collecting, Displaying, & Analyzing Data: Measures of Central Tendency & Histogr
This assessment allows students to use actual data they've collected and apply it to find the measures of central tendency and create histograms. This is a great end of the unit project or assessment.
Subjects:
Grades:
6th - 7th
Types:
Research Poster Project Freebie
This research project rubric is part of a larger lesson plan for creating research poster projects. Check it out here: Algebra Research Project: Interpreting Functions.Please follow me to hear about new discounts, freebies and product launches. Visit my Beautiful Mathematics Store for more engaging math lessons. Provide feedback and get TPT credit on future purchases: Go to your My Purchases page. Click on the Provide Feedback button beside each purchase. You will be taken to a page where you
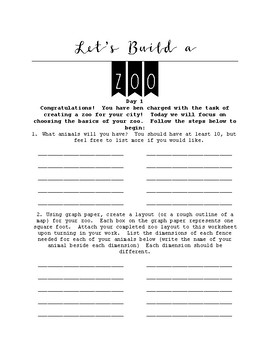
Let's Build a Zoo
This is a preplanned three day project designed for 8th grade students focusing on the CCSS's 8.F.B.4 and 8.F.B.5 along with mathematical practices 4 and 5. Each of the steps for each day are clearly outlined in these student worksheets and there are rubrics for each day and a final rubric for the entire project.

Scientific Process- Best way to store popcorn
Simple science experiment using the scientific method to set up an experiment and to collect data. It has pages to fill in responses to teach students the scientific method. Students will learn from this experiment on how to set up their future experiments and how to use the scientific method to record their data.
It can be viewed as a mini lesson for learning how to use the scientific method for science projects. This will take 3-5 class sessions, depending on whether this is their first lesso
Subjects:
Grades:
5th - 7th
Types:
CCSS:
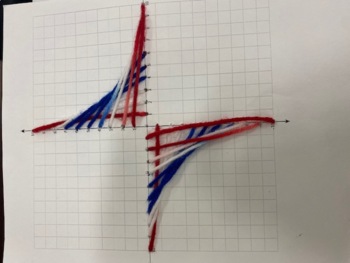
Standard Form Yarn Art Project
This project will demonstrate student understanding of Standard Form and plotting the x and y intercepts. Disclaimer- this project does not allow the students to graph the ENTIRE linear equation, just the x and y intercepts and connecting those two points.
Grades:
7th - 9th
CCSS:
Showing 1-22 of 22 results


