163 results
Free high school graphing lessons
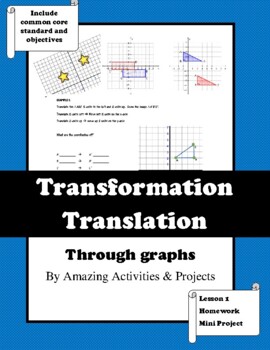
Transformation Translation
This lesson #1 on translation is designed for a Grade 8 math course aligned to Common Core or a geometry course. Also could be used in high school geometry course. The activities in this lesson require students to draw figures on coordinate plan to investigate translation. Students will learn to use the mathematical notation for translation.Common Core Standards: 8.G.A.1, 8.G.A.2, 8.G.A.3, 8.G.A.4, and 8.G.A.5Included in this download.★ Rules for translation★ Lesson notes and guided examples.★
Subjects:
Grades:
8th - 10th
Types:
Algebra Performance Task: Multistep Equations with Tables and Graphs
10 pages, aligned with common core standards. The cornerstone lesson to what I consider to be easily the best unit I can offer my algebra students. This lesson is part of a series of problems I created that are focused around graphing linear functions and the use of new tools (tables, graphs, equations) to solve problems in context. Students use multiple methods to explore functions and multi-step equations (in one variable) in the course of two application problems: a botany experiment and a ca
Grades:
7th - 10th
Types:
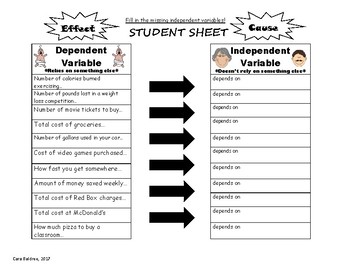
Dependent and Independent Variables REAL LIFE EXAMPLES
Do you need real life examples to demonstrate to students dependent and independent variables for math? This was designed as an introductory lesson showing the cause and effect nature of independent and dependent variables (like adults and babies) attached to real life examples. Students have a page where they add the scenario to the independent variable AS WELL AS another page where students write possible story problems using the situation. Thanks for the feedback!Check out:Multiplication and
Subjects:
Grades:
6th - 10th
Types:

Exponential Functions - Viral Tweets Exploration Activity
Engage students in this exploration activity introducing the concept of exponential functions! Students will graph and write an exponential function from data, distinguish between linear and exponential functions, and reason quantitatively in the context of a fun real world problem.
Hook students with a fun scenario: Leonardo DiCaprio finally won the award for Best Actor! What happens when a meme instantly goes viral on Twitter?
I use this activity as a way to have students explore the concept
Subjects:
Grades:
7th - 12th
Types:
CCSS:
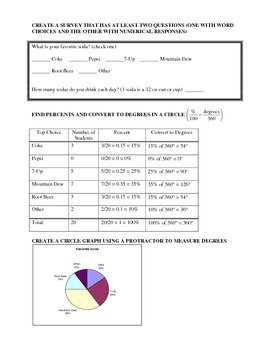
Construct a Survey Lesson/Project Plan
This PDF document consists of three parts: a lesson plan, project instructions, and a grading rubric. The lesson has students construct a survey that will have at least two questions: one that is multiple choice and one that has a numerical answer. It can either be an individual assignment or a group assignment and takes 2-3 days. I used this towards the end of the year as a review exercise since it covers multiple concepts: percents, circle graphs, central tendency (with outliers), box-and-whis
Subjects:
Grades:
6th - 9th
Types:
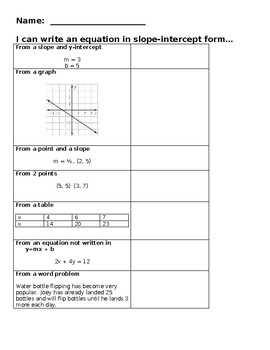
Writing Linear Equations in Slope-Intercept Form
This can be used as a quick warm-up or exit ticket to check for students ability to write equations in slope-intercept form given different information. Students are asked to write from a slope and a y-intercept, a slope and a point, two points, and a word problem. Students, also, need to rewrite an equation not given in slope-intercept form.
Subjects:
Grades:
7th - 10th
Types:
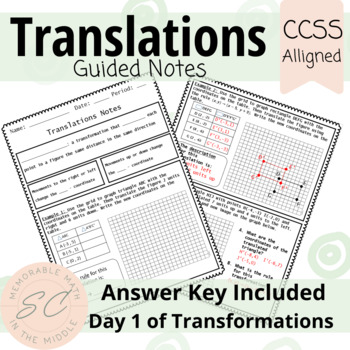
Translations Guided Notes and Answer Key
This lesson has everything you need to teach translations! These guided notes have three detailed examples where students will be filling in tables, graphing images and pre-images, and writing descriptions and rules for the transformations. With easy to read graphs and tables to record coordinates, your students will be sliding figures all over the coordinate plane! Also, if you download my Translations Task Cards you will have a complete lesson with lots of practice for your students!What I lo

Following Directions Optical Art Measuring project.
This project makes students follow directions and use a metric ruler. It is an awesome project for the last few days of a quarter. Students will need a regular printer paper, a metric ruler, and a pencil.
There are plenty of chances for high end students to go above and beyond on this project.
Subjects:
Grades:
4th - 10th
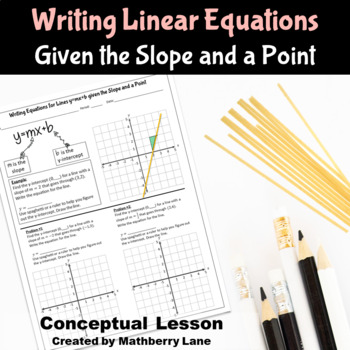
Writing Linear Equations Hands on Lesson with Spaghetti
Writing Equations for Lines given a point and the slope: y=mx+b Grade 8This lesson plan includes a conceptual understanding activity with using spaghetti to model linear functions on a graph in order to find the y-intercept. The second part of this lesson, students use the traditional strategy of substituting the values for the slope and an (x,y) coordinate in order to solve for the y-intercept.A ruler or spaghetti may be used for the modeling part of this lesson.What's Included?Pages 1-2 Conc
Grades:
6th - 9th
Types:
CCSS:
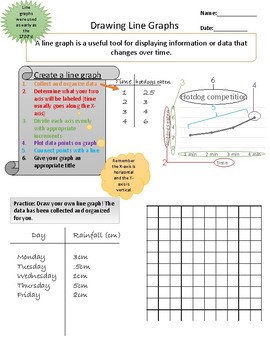
Line Graph Review and Practice
This worksheet provides students with a sample graph and step by step directions to create their own line graphs. Students can read through the directions while studying a complete graph and then apply that knowledge on the same page to check their understanding. Includes helpful tips and fun facts and an answer key. This file comes complete with a colored worksheet as well as a printer friendly gray-scale copy.
Subjects:
Grades:
5th - 10th
Types:
Data Analysis Activity - Mean, Median, Mode and Range
An engaging student-led activity whereby the students will collect the measurements of other student's hand spans and then analyze this data.
Student will find mean, median, mode and range and then graph the data using a bar graph, histogram, line graph, etc.
If you download this activity, please rate it and leave comments. Thank you! :)
Subjects:
Grades:
7th - 9th
Types:
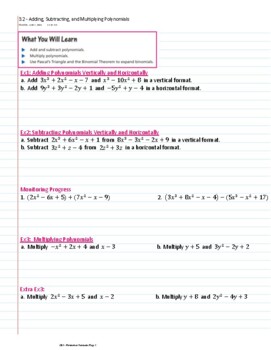
3.2 - Adding, Subtracting, and Multiplying Polynomials Guided Notes
These are guided notes for Adding, Subtracting, and Multiplying Polynomials.https://www.youtube.com/channel/UCkIKDr88dVyIue_n8ZzOCeA/playlists I have made video lesson for the entire year of Integrated math 3 (algebra 2) and trig and will be making my guided notes available here. My YouTube channel is called "Janice Parks" and the videos a FREE to use.

Geometric Transformations: Radial Art
This project is a fun, creative, and real world way to incorporate geometric transformations. In this project student will began by making a rough draft of their art work on graph paper using step by step instructions. They will perform rotations, reflections, and translations. (You can also choose to include dilations). They can answer the questions pertaining to the transformations they made.They will make a final draft of their artwork using a blank canvas or another sheet of graph paper. The
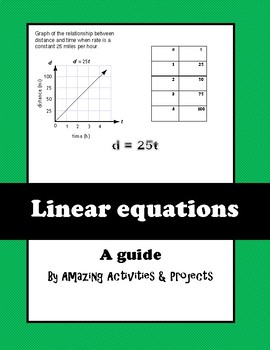
Linear equations
Linear Equations (Algebra 1 Curriculum )This bundle contains step by step notes for student or teacher and 9 activities on following topics:• Plotting points on a coordinate plane• Slope from a Graph• Slope from Ordered Pairs using the Slope Formula• Graphing by Slope Intercept Form• Writing Linear Equations: Slope Intercept Form Activity 1: Writing coordinate given points on the graph.Activity 2: Plotting points on a coordinate plane to make shape.Activity 3: Plot points on coordinate plane
Grades:
8th - 9th, Adult Education
Types:
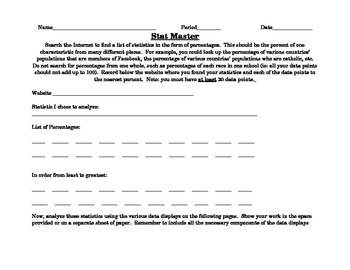
Stat Master- Statistics Analysis and Data Displays
This web-based performance task allows students to find statistics on the internet and the analyze and display the statistics using various displays. Finally, students are prompted to write about their analysis, explaining when specific displays are used and justifying their choice of a given display.
The data analysis and displays included are:
-Measures of Central Tendency (mean, median, mode)
-Measures of Variation (extremes, quartiles, or five-point summary)
-Box-and-Whisker Plot (or Box p
Subjects:
Grades:
5th - 9th
Types:

Properties of Lines: Finding Slope, X-Intercept, and Y-Intercept
This lesson is perfect for those kids who have learned how to plot points (ordered pairs) and are transitioning to linear equations. By having them plot only two points and connect those dots, they can explore slope, x-intercepts, y-intercepts, slope-intercept form, and how to find other points along the new line. To assist students new to graphing lines (and to assist teachers in teaching it,) all x- and y-intercepts in this assignment are whole number answers. The answers to slope, however,
Subjects:
Grades:
6th - 9th
Types:
Slope (Rise over Run) Math SPED Lesson
Love this Mathematics lesson and want more great ideas? Get the entire 21 lesson bundle & video here!This Mathematics Slope SPED lesson plan is geared towards high school students with intellectual or moderate disabilities who must master Ohio's Learning Standards Extended and take the Alternate Assessment or other states' equivalent.Students watch a two minute video clip about the steepest street in the world - Canton Avenue found in Pittsburgh, Pennsylvania - to hook them into the lesson.P
Subjects:
Grades:
7th - 12th, Adult Education
Types:
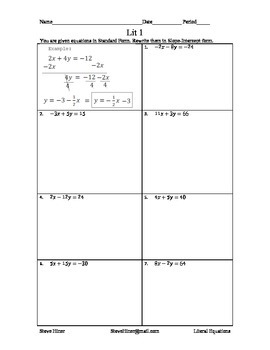
Literal Equations featuring slope intercept form among other types
This package of lessons contains 3 worksheets for students to complete to practice re-writing equations by solving for a given variable.
The first two worksheets contain 15 problems each. An example is given and worked out for the students. Then, students solve problems and re-write equations into slope-intercept form.
In Lit2, the last 4 problems reverse the process: Students are given equations in slope-intercept form and instructed to re-write them in standard form.
The third worksheet h
Subjects:
Grades:
7th - 10th
Types:
Rigid Motion Transformations "Do all the Things"
My “Do all the Things” series puts multiple standards and skills together on one page so students can easily make connections between “all the things” taught during a unit or for a specific concept. Every “Do all the Things” includes lesson, homework and full solution answer key.Rigid Motion Transformations "Do all the Things" includes: Reflections over the x-axis, y-axis, y = x line, y = -x line, rotations 90 degrees clockwise and counterclockwise, rotation 180 degrees and a translations
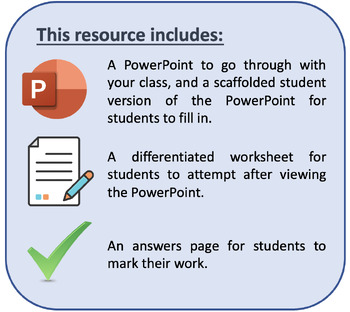
Straight Line Graphs - Finding the Equation of a Line
This resource includes:A PowerPoint that can be used with a class,A scaffolded student version of the PowerPoint with gaps for the students to fill in,A differentiated worksheet with answers included.This resource is suitable for Year 9 and 10 students and is linked to the Australian curriculum. This resource focuses on determining the equation of a straight line from a graph, given the gradient and one coordinate and given two coordinates.
Grades:
9th - 10th

Functions
Functions are frequently tested on state tests, but I find that textbooks don't do a thorough job of covering this topic.
This is .ZIP file that contains a SmartNotebook file and a PDF file that I use to review all the characteristics of a function. The slides cover max/min, zeros of a function, range and domain, continuity, vertical line test, etc. Students find the graphs very easy to see and it is easy to add on to if you would like.
Grades:
8th - 9th
Types:
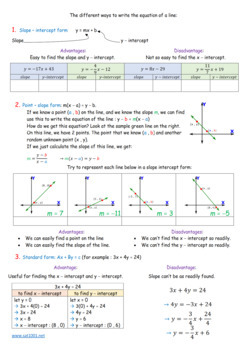
Linear equation standard form of a line Introduction
This is a one page concise but comprehensive introduction about the different ways that a linear equation can be represented. The three forms in this worksheet are:1. The slope - intercept form.2. The point - slope form.3. The standard form.Examples and illustrations are provided. There are also a small number of questions to practice. A separate solution sheet has also been provided.PLEASE NOTE: this product is also available in my Algebra 1 packet, please click below:"Algebra 1 Complete Course
Subjects:
Grades:
9th - 12th
Also included in: Linear equations / equation of the line BUNDLE
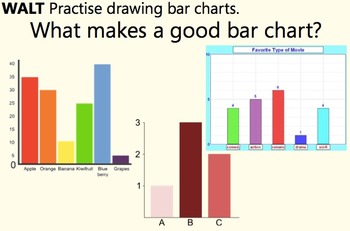
Bar chart / graph practice in context of friction
A stand-alone lesson giving your students a chance to practise drawing bar charts, or this could be used (as I did) as a follow-up to a lesson investigating friction.
This download includes:
A worksheet in PDF and editable Word format including a table of results for a friction experiment. Students must work out some missing averages and draw a bar chart of the experiment. There's a checklist of what to include on the bar chart.
A PowerPoint file with the objective and differentiated outcomes
Subjects:
Grades:
6th - 9th
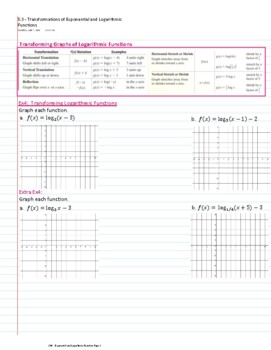
Transformations of Exponential and Logarithmic Functions - guided notes (5.3)
transformations of exponential and log functions - guided notesThere is a free video lessons to go along with these guided notes on my YouTube channel called "Janice Parks".https://www.youtube.com/channel/UCkIKDr88dVyIue_n8ZzOCeA/playlists
Showing 1-24 of 163 results


