218 results
High school statistics task cards
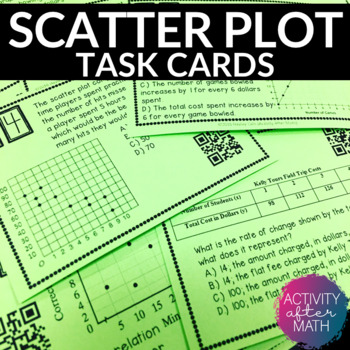
Scatter Plots and Line of Best Fit Task Cards with QR Codes
Get your students involved with practicing Interpreting Data with Scatter Plots and Line of Best Fit! Task cards include multiple choice problems and constructed response. Click here to SAVE and get this as a Task Cards BUNDLEThis resource includes:Teacher InstructionsTeacher TipsStudent Instructions24 Task cards with QR codes24 Task cards without QR codesBlank Answer Document for studentsAnswer Key for easy gradingOptions for using this resource:You can print the ones with QR codes for students
Subjects:
Grades:
8th - 9th
Types:
Also included in: 8th Grade MATH TASK CARDS BUNDLE
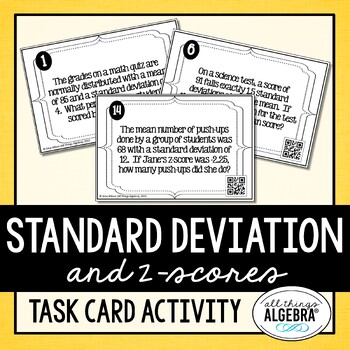
Normal Distribution, Standard Deviation, Z-Scores | Task Cards
Normal Distribution, Standard Deviation, Z-Scores Task CardsStudents will practice calculating and interpreting z-scores, normal distribution, and standard deviation in real world contexts by working through these 20 task cards. These are challenging and diverse questions that require students to read carefully. They can check their answers by scanning the QR code on each card. Connection to the internet is not required to scan the code. However, a QR scanner app is required on the device.
Subjects:
Grades:
8th - 12th
Types:
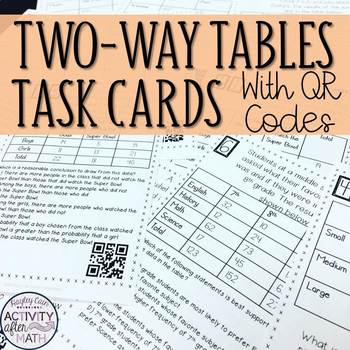
Two-Way Tables (Interpreting Data) Task Cards with QR Codes
Get your students involved with practicing Interpreting Data with Two-Way Tables! This is a great activity that can be used in Math Centers, as individual work, or as a group activity! This gets students moving and also integrates the use of technology into the classroom by scanning QR Codes to check your answer to get immediate feedback!Click here to SAVE and get this as a Task Cards BUNDLEThis resource includes:Teacher InstructionsStudent Instructions20 Task cards with QR codes20 Task cards wi
Subjects:
Grades:
8th - 9th
Types:
CCSS:
Also included in: 8th Grade MATH TASK CARDS BUNDLE
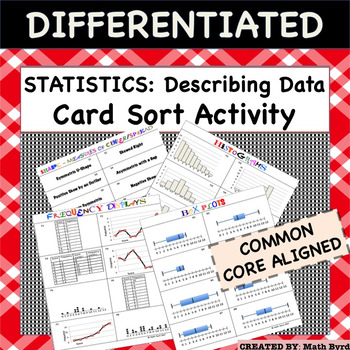
Statistics:Representing & Interpreting Data (Histogram, Box Plot, Dot Plot)
Complete Lesson! This lesson features a 40 CARD SORT, Differentiated Cornell Notes, Distribution Shapes Graphic Organizer, and Power Point to go with the notes! Perfect for the inclusive classroom! Within the Card Sort Activity there are 5 categories of cards to match: 1) Histogram2) Frequency Display (including Dot Plots, Frequency Line Graphs and Tables)3) Box Plots4) Describing Shape5) Describing Measures of Center & Spread. With 8 different sets of matches, there are 40 cards total. Stud
Subjects:
Grades:
8th - 12th
Types:
CCSS:
Also included in: Common Core Algebra 1 CARD SORT ACTIVITIES - BUNDLE PRICE!
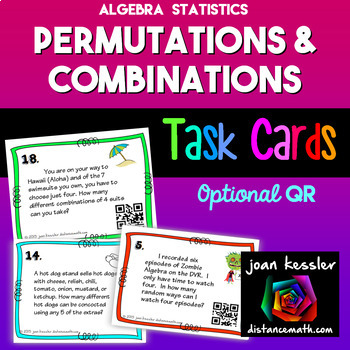
Permutations and Combinations Task Cards plus QR
This set of Combinations, Permutations, and Counting Task Cards with applications will really have your students thinking.This activity reinforces the concepts of permutations, combinations, and counting principles. The concepts are not separated on the cards, nor coded, so students must first decide what type of question it is before solving. Th cards can also be used for a sorting activity. The difficulty levels are mixed on the cards. Included: Two sets of 24 cards, one with QR codes and
Subjects:
Grades:
7th - 10th
Types:
CCSS:
Also included in: Algebra 1 Activity Bundle
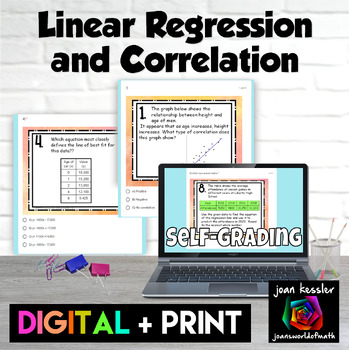
Linear Regression and Correlation Digital plus Print with TI-84 notes
This Linear Regression and Correlation activity is a great way for your students to practice their skills. There are 12 well chosen representative problems. Digital and printable PDF versions included. Questions include:CorrelationLine of Best FitProjecting TrendsFind the linear regression from a tableFind the linear regression from a scatter plotDetermining the correlation coefficientThe editable digital self checking version can be used as an Quiz, HW, or Paperless worksheet and is designed
Subjects:
Grades:
8th - 10th
Types:
CCSS:
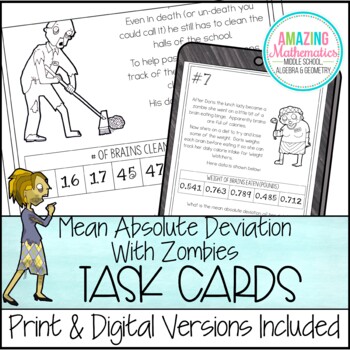
Mean Absolute Deviation Activity - Halloween Math
This is a set of 10 Zombie Themed task cards to practice calculating mean absolute deviation. All numbers round nicely at both the mean and mean absolute deviation steps.Student response sheet and answer key included.Please visit my other Mean Absolute Deviation product as well:Mean Absolute Deviation Mazeo Click Here for more Zombie Math activitiesThis product is also part of the following money saving bundle:8th Grade Math Bundle ~ All My 8th Grade Math Products for 1 Low Price---------------
Subjects:
Grades:
6th - 10th
Types:
Also included in: 8th Grade Math Bundle ~ All My 8th Grade Math Products at 1 Low Price
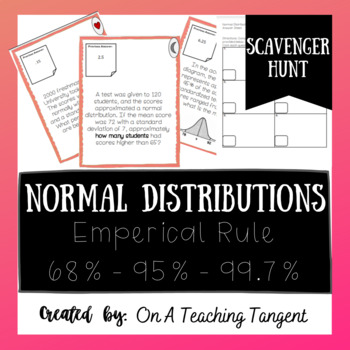
Normal Distributions Scavenger Hunt!
This scavenger hunt includes 12 normal distribution word problems. Students should know the Emperical Rule and be able to calculate percentages and values for each normal distribution. No standardized values are included in this purchase. Please check out the preview before purchasing to make sure the difficulty level meets the needs of your students.Answer key is included!
Subjects:
Grades:
9th - 11th
Types:
CCSS:
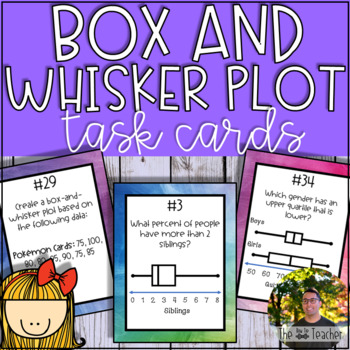
Box and Whisker Plot Task Cards (40 Task Cards)
“Practice Makes Perfect!” With these task cards, your students will be able to practice key mathematical concepts.The product includes:40 Box-and-Whisker Plot Task CardsAnswer KeyRecording Sheets (4 versions)Color and Ink-Saver versions available. Aligned to Common Core State Standards.You can get your students engaged with these cards in a variety of ways. For example: Footloose, math centers, stations, SCOOT!, test prep, pre/post assessments, and Kagan Structures like Quiz-Quiz-Trade and Fan-
Subjects:
Grades:
5th - 10th
Types:
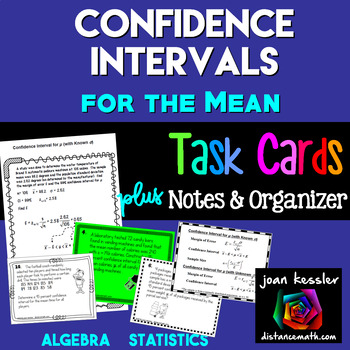
Confidence Intervals for the Mean
Your students will grasp Confidence Intervals for the Mean with this resource which includes Guided Notes, Task Cards, and a Graphic Organizer.What's Included?18 Task Cards for students to practice constructing confidence interval for the mean using the z - distribution and the t - distribution.Cards # 1 - 8 find Confidence intervals given statisticCards # 9 - 10 find Confidence intervals given dataCards # 11 - 12 find sample sizeCards # 13 - 15 find the margin of errorCards # 16 - 18 Given
Subjects:
Grades:
9th - 12th
CCSS:
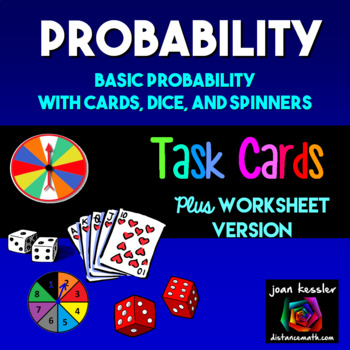
Algebra Statistics Probability Task Cards
This set of 26 Probability Task Cards cards reviews basic probability concepts of independent and dependent events using dice, spinners, and a standard deck of playing cards. These are appropriate for grades 6 - 9. By using a familiar and limited sample space, students will less likely get confused by the rules and be able to grasp the concepts fulfilling the CCS for Probability. They will be learning based on familiar topics, but expand their cognitive thinking skills with the questions asked.
Subjects:
Grades:
6th - 9th
Types:
CCSS:
Also included in: Algebra 2 Activity Bundle
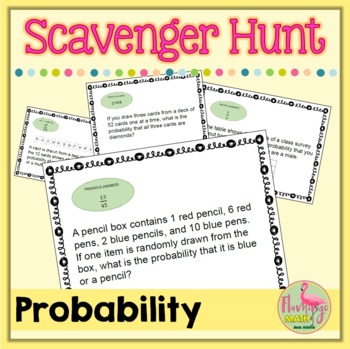
Probability Scavenger Hunt (Algebra 2 - Unit 12)
This Probability Scavenger Hunt Activity is designed to help your Algebra 2 students understand permutations, combinations, theoretical and experimental probability, independent and dependent events, two-way tables, conditional probability, and compound events at the end of the unit on Probability. There are 12 task cards in the activity.Students begin at a specified station, their answer leads them to the next task card. If done correctly, they will end where they began. A student recording sh
Subjects:
Grades:
8th - 11th, Higher Education
Types:
Also included in: Algebra 2 Curriculum Mega Bundle | Flamingo Math
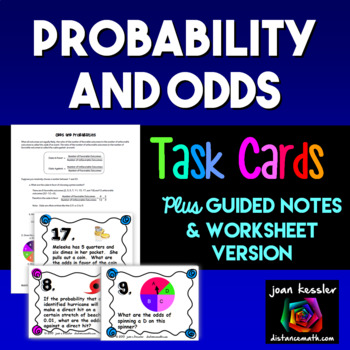
Probability and Odds Task Cards Guided Notes
This resource on Statistics: Odds and Probability is designed for Algebra or Statistics. Who doesn't get odds and probabilities confused? This set of cards and guided notes should reinforce those skills so that student will understand the difference and be able to determine simple odds and probabilities. Included: 20 Task Cards. Students determine the odds from a given situation and also determine the odds given a probability. Both odds in favor and odds against are part of the activity.Guid
Subjects:
Grades:
7th - 10th
CCSS:
Also included in: Probability and Statistics Algebra 2 Unit 11 Activity Bundle
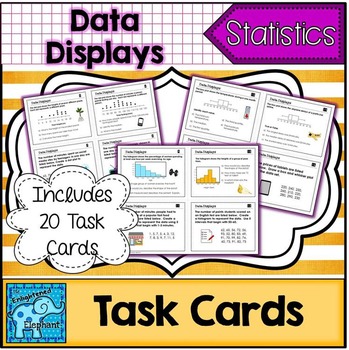
Data Display Task Cards
There are 20 total task cards, a student recording sheet and answer key. These tasks meet HSS.ID.A.1, HSS.ID.A.3, HSS.ID.B.6
There are 4 questions for each of the following types of data displays:
dot plots
stem and leaf plots
histograms
box plots
scatter plots
Students will be asked to read and interpret each type of data display as well as create each type of data display from a contextual set of data.
Use task cards at centers or stations, for entrance and exit tasks and for activities lik
Subjects:
Grades:
7th - 10th
Types:
CCSS:
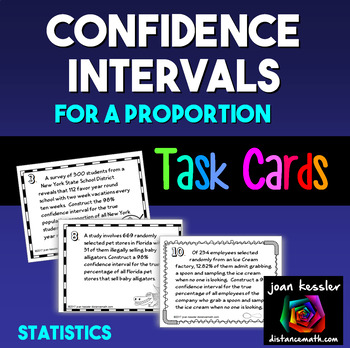
Confidence Intervals for a Proportion Applications
This Confidence Intervals for a Proportion Real World Applications resource will engage your students and give them fluency with confidence intervals.What's included? 12 Task Cards designed to reinforce the concepts taught in class. The illustrated cards include 90, 95, 98, and 99% confidence intervals for real life (some humorous) applications. Student response sheets which include room for students to show work. They are unnumbered so you can choose all or some of the problems. Answer keys
Subjects:
Grades:
9th - 12th
Types:
CCSS:
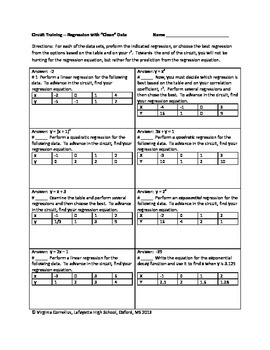
Circuit Training - Linear, Quadratic and Exponential Regression
Give your students engaging practice with the circuit format! Students will need to use technology (graphing calculator, on-line software) to calculate regression equations to advance in the circuit. At first students will be told what kind of regression, but towards the end of the circuit students need to try several regressions and compare the r-value to see which is the best fit. 16 equations total. Can be turned into task cards or even a scavenger hunt.In addition, many of the answers ar
Subjects:
Grades:
8th - 11th, Higher Education
Types:
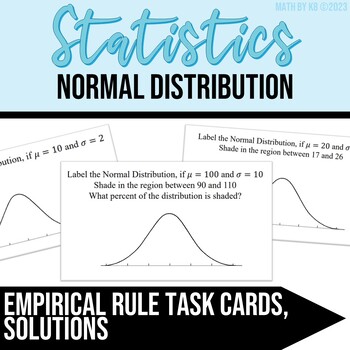
Normal Distribution Empirical Rule
Normal Distribution Using Empirical Rule, labeling mean and standard deviation and shading desired area! Concepts needed for this activity: Basic understanding of Normal Distribution1, 2, and 3 standard deviations above and below Empirical rule (68, 95, 99.7) OR knowledge of z-score to find percentages They start out basic, having the students label the mean and standard deviations on a Normal curve, then have the students shade a desired area and end with the students calculating a probability
Subjects:
Grades:
9th - 12th
Types:
CCSS:
Also included in: Normal Distribution
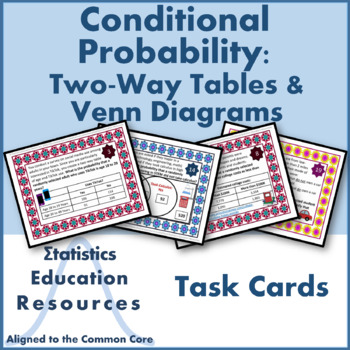
Conditional Probability Task Cards: Two-Way Tables & Venn Diagrams (Common Core)
Conditional Probability Task Cards: Two-Way Tables and Venn Diagrams (Common Core Aligned) This product includes 20 task cards (4 cards per page): 8 cards on computing conditional probability from two-way tables 8 cards on computing conditional probability from Venn diagrams 4 cards on computing conditional probability using a model of one’s choice.Task card questions range from introductory to advanced. This range helps struggling students learn and practice basic concepts while keeping acceler
Subjects:
Grades:
9th - 12th
Types:
CCSS:
Also included in: Bundle Probability Task Cards (80 Cards) (Common Core Aligned)

Probability, Simple & Compound Task Cards
Probability, Simple & Compound Task Cards
This is a set of 24 task cards covering multiple representations of simple and compound probability. The questions are differentiated for a wide range of learners. These cards would be great for bell ringers, math stations, test prep, review, or just for fun!
What you get:
➸ 24 color task cards
➸ 24 black and white task cards
➸ Student answer sheet
➸ Key
You can laminate these and use them again and again. You could also hole punch each and keep
Subjects:
Grades:
5th - 9th
Types:
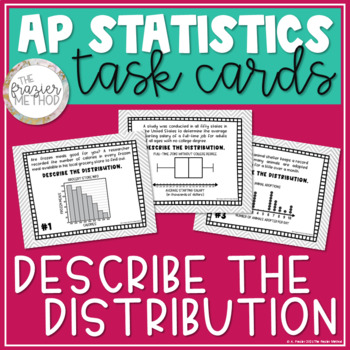
AP Statistics Task Cards Review Activity Describe the Distribution Data Displays
Use these DESCRIBE THE DISTRIBUTION TASK CARDS to help your students review for the AP Stats Exam! Students will describe the shape, center, spread, and unusual features of distributions displayed in a histogram, boxplot, stem-and-leaf plot, dot plot, and cumulative relative frequency plot. AP Statistics students will also determine which measure of center (median or mean) and measure of spread (range, standard deviation, or interquartile range) to use based on the shape of the distribution – sk
Subjects:
Grades:
10th - 12th, Higher Education
Types:
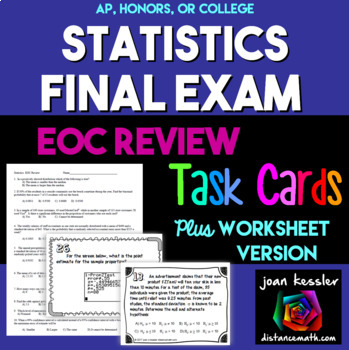
Statistics Final Review Task Cards plus Practice Test
This Statistics Final - Review - Task Card Resource is a great Final Exam Practice or Review for AP Statistics; Honors Statistics, or College Statistics.Sometimes a worksheet isn’t enough to gets students motivated, especially for an end of course review. Activity Based Learning with Task Cards really does work to help reinforce students' skills. Task and Station Cards get your students engaged and keep them motivated. Use all at once or as many as you like. Ideas for using Task Cards included i
Subjects:
Grades:
9th - 12th
Types:
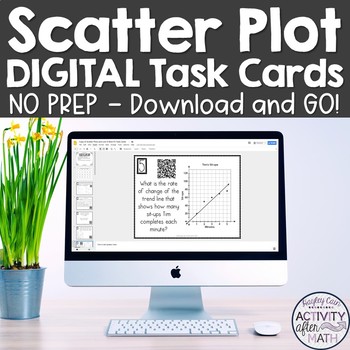
Scatter Plots Line of Best Fit Digital Task Cards Distance Learning
GOOGLE Slide Version Get your students involved with practicing Interpreting Data with Scatter Plots and Line of Best Fit! Task cards include multiple choice problems and constructed response. This is a great activity that can be used for distance learning and review in math centers, as individual work, or as a group activity! This integrates the use of technology into the classroom by allowing students to use their phone, tablets, laptops, and desktops to view the task card and by being able to
Subjects:
Grades:
8th - 9th
Types:
Also included in: 8th Grade Math DIGITAL TASK CARDS BUNDLE Google Slides
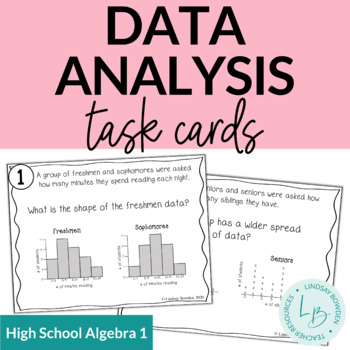
Data Analysis: Spread, Center, and Shape Task Cards
The digital version of this resource for Google Drive™ using Google Forms can be found here: Distance Learning: Data Analysis Digital Task Cards. You are able to edit this assignment using Google Forms and assign it to your students via Google Classroom.These data analysis task cards includes:comparing data of two sets using histograms, dot plots, and box and whisker plotsshape (symmetrical, skewed right, skewed left)center (mean, median)peaks (mode)spread (from looking at the graph)12 task card
Subjects:
Grades:
8th - 10th
Types:
CCSS:
Also included in: Statistics Unit Bundle
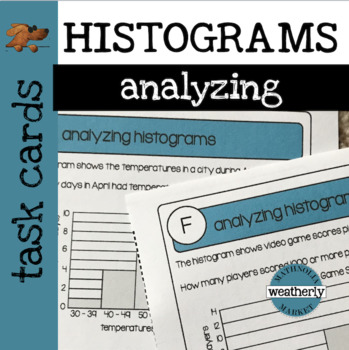
STATISTICS - Analyzing HISTOGRAMS Task Cards
This set of task cards provides practice analyzing histograms after students have been introduced to the concept.
It is important that students understand that histograms are organizational displays that present data in intervals. These histograms are used to identify certain characteristics of the data; such as the median, the number of data points, and a comparison of data in respect to the intervals.
Included are 10 problems on individual cards.
TWO OPTIONS are included for recording answ
Subjects:
Grades:
6th - 9th
Types:
Showing 1-24 of 218 results

