454 results
High school statistics centers
Deal or No Deal Probability Game for Grades 6 and up
Play a game while learning---what more can a student want? Introduce this take on a popular television game show, Deal or No Deal, to get your students engaged in the study of probability. This pack includes:Directions for contestant/bankerGame sheets for contestant/bankerBrief cases 1-25 (laminate these for durability)Brief cases for $.01-$1,000,000 (laminate these for durability)You may also want to put velcro on the back to make it easier to play and switch cases!Leave feedback and comments
Subjects:
Grades:
6th - 12th
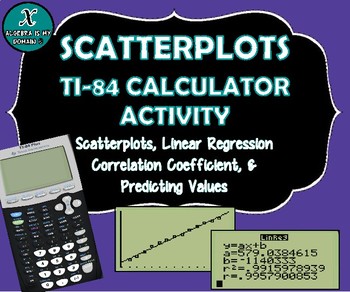
TI-84 CALCULATOR ACTIVITY - Data, Scatterplots, Regression & Line of Best Fit
This file includes four linear regression examples (all real-life data). The examples cover the following topics for the TI-84 graphing calculator:
* Creating a scatterplot
* Performing linear regression (finding the equation of the best-fit line)
* Interpreting the slope of the equation
* Calculating and interpreting the correlation coefficient
* Predicting values (using the linear regression equation)
The first example gives the step-by-step instructions to calculate all the necessary value
Subjects:
Grades:
7th - 12th, Higher Education
Types:
CCSS:
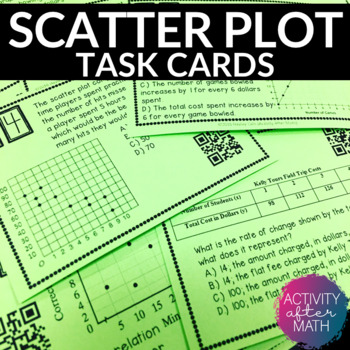
Scatter Plots and Line of Best Fit Task Cards with QR Codes
Get your students involved with practicing Interpreting Data with Scatter Plots and Line of Best Fit! Task cards include multiple choice problems and constructed response. Click here to SAVE and get this as a Task Cards BUNDLEThis resource includes:Teacher InstructionsTeacher TipsStudent Instructions24 Task cards with QR codes24 Task cards without QR codesBlank Answer Document for studentsAnswer Key for easy gradingOptions for using this resource:You can print the ones with QR codes for students
Subjects:
Grades:
8th - 9th
Types:
Also included in: 8th Grade MATH TASK CARDS BUNDLE
Conditional Probability Two-Way Frequency Tables Scavenger Hunt Activity
Conditional Probability Two-Way Frequency Tables Scavenger Hunt Activity
During this activity, students travel around the room answering conditional probability questions involving two-way frequency tables.
This activity is a great opportunity to group students or let students work with a partner. Students begin by starting at a random station. After a student has found the answer to a station, he will visit the next station using the answer he found. Students continue to move at their own pa
Subjects:
Grades:
6th - 12th
Types:
CCSS:
Box and Whisker plots: Understanding, Identifying & Analyzing.
Box and whisker plots pose many problems for students. They often confuse the length of a quartile for the size of data it includes. After seeing my students struggle with this concept for years (even more-so because they had to analyze the data, not merely create the plot) I came up with this activity. The coloring piece, coupled with the dollar bill comparison made something click. I've used the activity ever since! **Please note this activity uses the American Dollar Bill as a portion of a
Subjects:
Grades:
7th - 10th
Types:
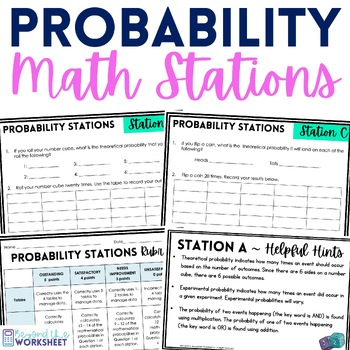
Probability Math Stations | Math Centers
⭐️⭐️ This set of math stations allow students to take a cooperative and hands on approach to learning about probability. Students compare the theoretical probability to their actual experimental results. ⭐️⭐️ A rubric is included, as well as the printables you need for each station (color cards, letter cards and the cuboctrohedron net). Also included are hint cards. You can decide whether or not you give the hint cards to students as they work through the stations. You simply need to provide coi
Subjects:
Grades:
6th - 10th
Types:
Also included in: 7th Grade Math Curriculum Supplemental Activities Bundle
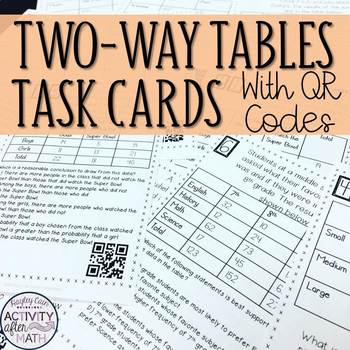
Two-Way Tables (Interpreting Data) Task Cards with QR Codes
Get your students involved with practicing Interpreting Data with Two-Way Tables! This is a great activity that can be used in Math Centers, as individual work, or as a group activity! This gets students moving and also integrates the use of technology into the classroom by scanning QR Codes to check your answer to get immediate feedback!Click here to SAVE and get this as a Task Cards BUNDLEThis resource includes:Teacher InstructionsStudent Instructions20 Task cards with QR codes20 Task cards wi
Subjects:
Grades:
8th - 9th
Types:
CCSS:
Also included in: 8th Grade MATH TASK CARDS BUNDLE
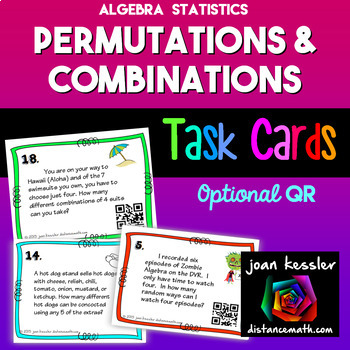
Permutations and Combinations Task Cards plus QR
This set of Combinations, Permutations, and Counting Task Cards with applications will really have your students thinking.This activity reinforces the concepts of permutations, combinations, and counting principles. The concepts are not separated on the cards, nor coded, so students must first decide what type of question it is before solving. Th cards can also be used for a sorting activity. The difficulty levels are mixed on the cards. Included: Two sets of 24 cards, one with QR codes and
Subjects:
Grades:
7th - 10th
Types:
CCSS:
Also included in: Algebra 1 Activity Bundle
Data Analysis and Statistics in Algebra 1 Google Forms Homework and Assessment
This Algebra 1 Google Forms bundle currently includes auto-grading assignments on the following skills related to data analysis and statistics:Measures of Central TendencyDot Plots and HistogramsBox PlotsStandard Deviation and The Empirical RuleTwo-Way Frequency TablesScatter PlotsEach assignment also includes a PDF "worksheet" for students to complete along with the form.All of the assignments in this bundle are also included in my:★ Algebra 1 (Semester 2) Google Forms BundleYou may also be int
Subjects:
Grades:
6th - 9th
CCSS:
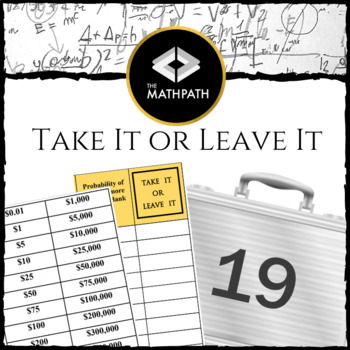
Take it or Leave it - Introduction to Probability Game
This product is absolutely perfect for introducing the ideas or probability in a fun and interesting way. This activity also works great if you have a spare class or need a fun sub plan.This product contains- detailed instructions- 26 printable briefcases- Student game sheetInstructionsThis product gives you the materials you need to have full class, game-show styled, fun! Your students will unify to try and get a good deal from the "banker" (that is you). After each round of the game, students
Subjects:
Grades:
7th - 9th
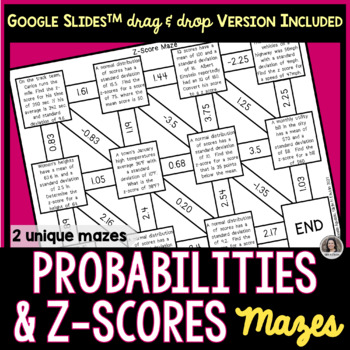
Z Scores and Probabilities of Normal Distributions Mazes Google Slides™ & Print
Make practicing math more fun with these 2 different mazes on finding z-scores and probabilities of normal distributions. For each self correcting maze activity, students will solve at least 9 problems. Types of Mazes*Finding Z-Score from a Word Problem Maze #1*Finding Probabilities or X-Values Given the Z-Score Maze #2Students may complete their work on the provided student response sheet that corresponds to the maze assigned. Note: Not all boxes are used. Included:TWO unique MazesA pdf with a
Subjects:
Grades:
6th - 12th, Higher Education
Types:
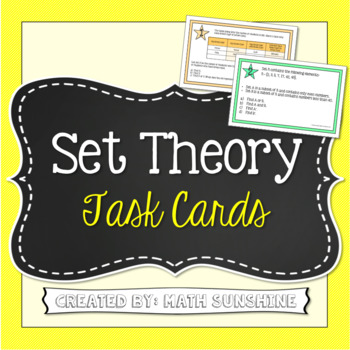
Set Theory with Venn Diagrams Task Cards Activity (And, Or, and Complement)
Set Theory Task Cards (Using And, Or, and Complement)
These 10 task cards are a fun way for students to practice identifying sets using AND, OR, and COMPLEMENT.
The task cards present sets in a variety of ways. Some cards include lists of numbers, while others include tables or lists of names. For each card, students must create a Venn diagram and answer 1 to 4 questions about the set. The cards get increasingly more difficult as students progress through the 10 cards.
These are the types o
Subjects:
Grades:
6th - 12th
Types:
CCSS:
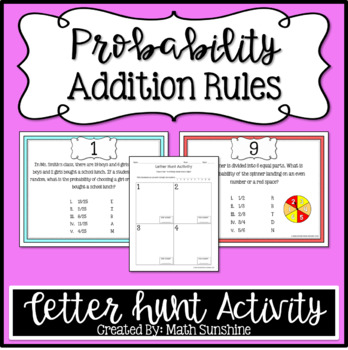
Probability Addition Rules Letter Hunt Activity
Probability Addition Rules Letter Hunt Activity:
This set of 10 stations lets students practice finding probabilities of different events using the Probability Addition Rule. In order to solve the problems, students will need to be able to distinguish between overlapping and mutually exclusive events.
Each station has multiple choice answers. After students have solved a station, they will find their answer on the paper and locate the matching letter. Then they will write the letter at the to
Subjects:
Grades:
6th - 12th
Types:
CCSS:

Candy Probability: Discovery of EXPERIMENTAL vs. THEORETICAL Probability
Middle Schoolers LOVE probability!
This is a GREAT lesson around Halloween when the kids are already hyped up on sugar and want to 'talk' to their classmates.
This activity allows the students to DISCOVER the differences between EXPERIMENTAL and THEORETICAL probability and connect it to everyday experiences. The probability lesson lends itself to fractions, decimals, percents, data collection, rational & irrational numbers, statistical graphs (box and whiskers, frequency tables...), measu
Subjects:
Grades:
5th - 9th
Types:
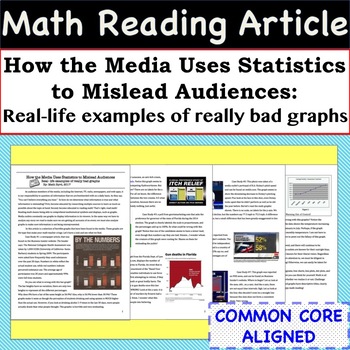
Statistics Math Article - Case Studies of Bad Graphs found in the Media
Incorporate Reading & Writing into the Math Classroom with this article and accompanying worksheet! The 4 page article is entitled - "How the Media Uses Statistics to Mislead Audiences: Real- life examples of really bad graphs". The worksheet helps students summarize the case studies and the article as a whole. This resource can be used in so many ways, some ideas are: station activity, independent reading assignment, small group activity, homework assignment, or whole class discussion.Skill
Subjects:
Grades:
8th - 11th
CCSS:
Also included in: Common Core Algebra 1 MATH READING ARTICLES - BUNDLE PRICE!
BACK TO SCHOOL STEM ACTIVITY: Spaghetti Marshmallow Challenge
Don't miss out on this wonderful opportunity for your students to work collaboratively, problem-solve, show creativity and use their math skills! This Spaghetti Marshmallow Challenge cost me less than $2.00 for all supplies but delivers such a big bang for the buck! Fun for students K-12 (they say that the kindergarteners actually build the highest!). Enjoy!
Subjects:
Grades:
PreK - 12th, Higher Education, Adult Education, Staff
Types:
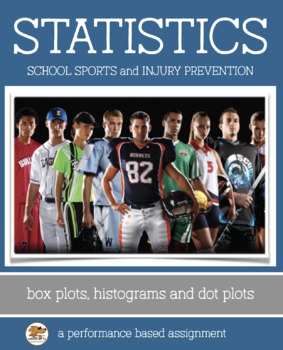
STATISTICS - Histograms, Box Plots, Dot Plots: A Performance-Based Task
Using Statistics in a Real World Scenario
Sports Injury and School Athletes
This packet includes two activities. The first activity guides students through 3 data analyses projects including identifying the best data display (box plot, histogram, dot plot) for the situation. The second activity is a performance task which asks students to critique the reasoning of others and refute a claim. In the process, students will learn that correlation does not imply causation. This can be independently
Subjects:
Grades:
8th - 11th
Types:
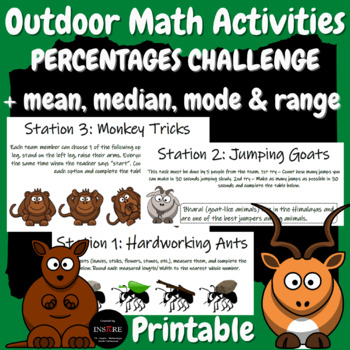
Outdoor Math Activities Percentages Percents Mean, Median, Mode, Range Printable
6 Math Work Stations. This is a perfect end of the year, back to school, math centers, summer camp, or summer school math activity. This engaging outdoor math project is a great team competition. Get your class outside to combine movement, fun, and math. This resource includes 6 stations’ worksheets for students ready to be printed (pdf and editable doc version). A scoring table is included. For each correct answer, the team gets 1 point, and for each wrong answer loses 1 point.This project cove
Subjects:
Grades:
6th - 9th
Types:
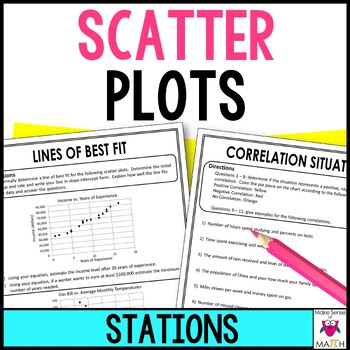
Scatter Plots Stations Activity | Lines of Best Fit, Correlation & Analyze
These math stations delve into scatter plots with a focus on correlation and informally analyzing lines of best fit. Students will create, analyze, estimate and explain. Students will develop a deep understanding of this content after completing these math stations. The following stations are included:Create and Analyze: Students will create and analyze a scatter plot. Noticing correlation, outliers and clusters. Lines of Best Fit: Students are given a scatter plot and are to informally dra
Subjects:
Grades:
8th - 9th
Types:
Also included in: Middle School Math Stations Bundle | Math Centers
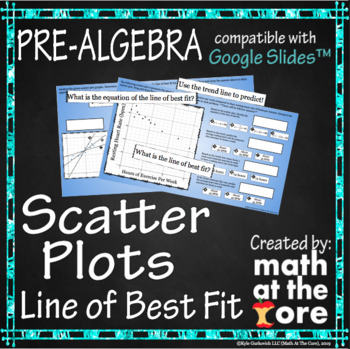
Scatter Plots - Line of Best Fit for Google Slides™
- Great for online and distance learning! Created to be compatible with Google Slides™!- In this digital activity, students will analyze scatter plots and determine the line of best fit. They will use the line of best fit and the equation of that line to predict values. They should be familiar with writing the equation of a line.- This activity includes 20 different problems involving analyzing scatter plots. Students will start with determining which line is the line of best fit for the given s
Subjects:
Grades:
7th - 9th
Types:
Also included in: Statistics - Unit 7 - BUNDLE for Google Slides™
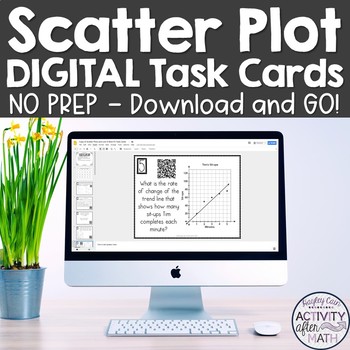
Scatter Plots Line of Best Fit Digital Task Cards Distance Learning
GOOGLE Slide Version Get your students involved with practicing Interpreting Data with Scatter Plots and Line of Best Fit! Task cards include multiple choice problems and constructed response. This is a great activity that can be used for distance learning and review in math centers, as individual work, or as a group activity! This integrates the use of technology into the classroom by allowing students to use their phone, tablets, laptops, and desktops to view the task card and by being able to
Subjects:
Grades:
8th - 9th
Types:
Also included in: 8th Grade Math DIGITAL TASK CARDS BUNDLE Google Slides
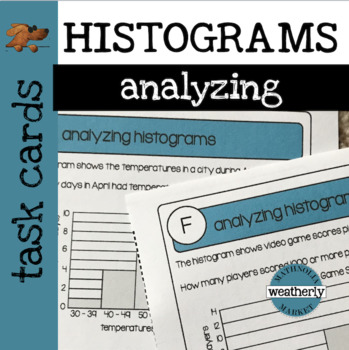
STATISTICS - Analyzing HISTOGRAMS Task Cards
This set of task cards provides practice analyzing histograms after students have been introduced to the concept.
It is important that students understand that histograms are organizational displays that present data in intervals. These histograms are used to identify certain characteristics of the data; such as the median, the number of data points, and a comparison of data in respect to the intervals.
Included are 10 problems on individual cards.
TWO OPTIONS are included for recording answ
Subjects:
Grades:
6th - 9th
Types:
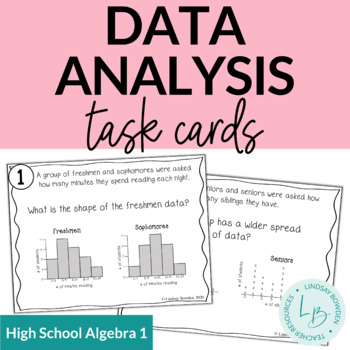
Data Analysis: Spread, Center, and Shape Task Cards
The digital version of this resource for Google Drive™ using Google Forms can be found here: Distance Learning: Data Analysis Digital Task Cards. You are able to edit this assignment using Google Forms and assign it to your students via Google Classroom.These data analysis task cards includes:comparing data of two sets using histograms, dot plots, and box and whisker plotsshape (symmetrical, skewed right, skewed left)center (mean, median)peaks (mode)spread (from looking at the graph)12 task card
Subjects:
Grades:
8th - 10th
Types:
CCSS:
Also included in: Statistics Unit Bundle
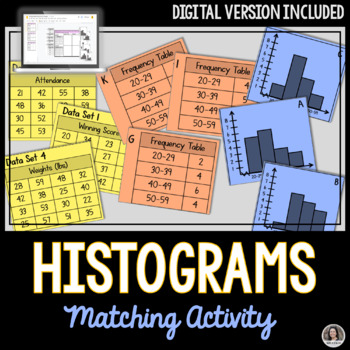
Histograms Matching Activity, Print and Digital Google Slides™
Practice makes perfect! This matching histograms activity is an ideal assignment for students to demonstrate their understanding of Histograms. Students match the data set to their corresponding frequency tables and histogram graphs. There will be 6 matches made when complete. Included:A pdf with a link to make a copy of the Interactive Google Slides™ for your own Google Drive™A printable version for students to sort and match.Student Response SheetAnswer keyDigital Version:Go paperless with thi
Subjects:
Grades:
7th - 12th
Types:
Showing 1-24 of 454 results

